AJUSSI GUIDE • INVESTOR LAB
Enter ticker symbols and portfolio weights to visualize how your holdings map across the AI infrastructure stack.
Most investors know which AI stocks they own. Far fewer know which part of the AI build-out they are actually exposed to — and that gap is where portfolios quietly become concentrated.
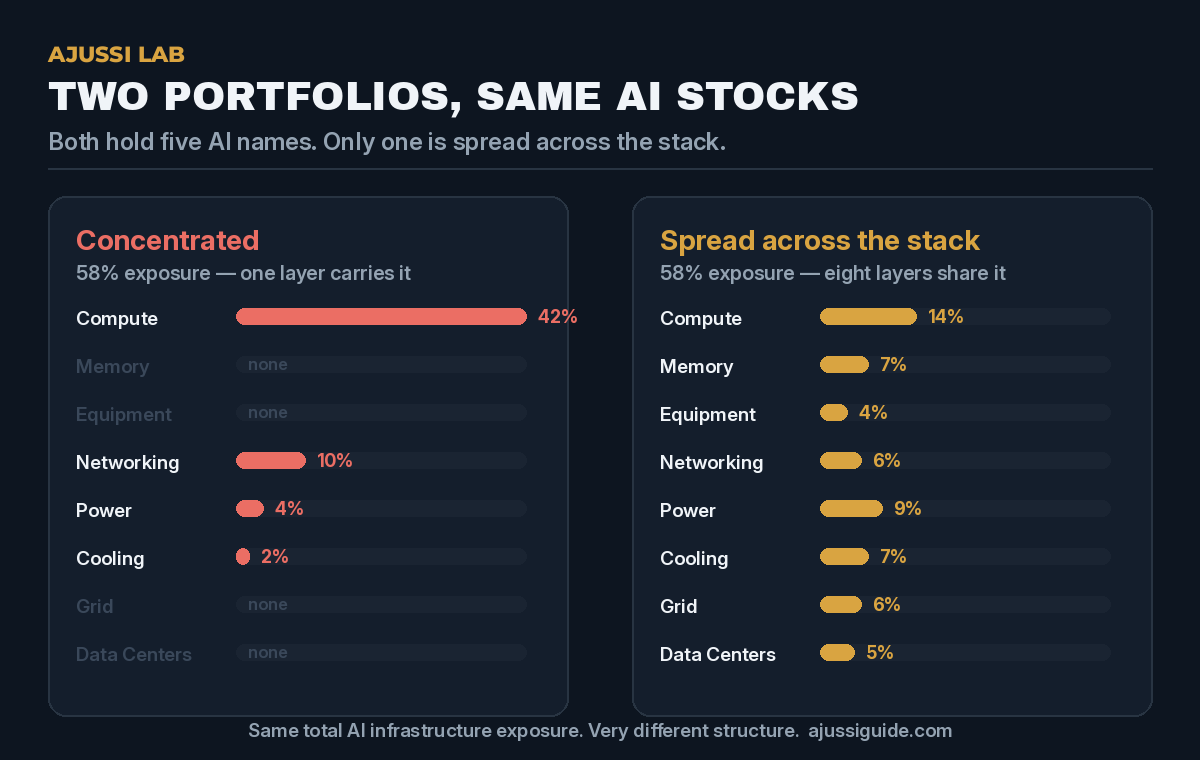
Your AI infrastructure portfolio exposure is not the same as the number of AI names on your statement. A portfolio holding NVIDIA, Microsoft and Vertiv looks diversified across three companies, but the money may be sitting in only two layers of a stack that has eight. Meanwhile the layers that decide whether racks actually get switched on — power, cooling, grid — can be missing entirely.
The tool above maps the weights you enter across eight layers of the AI infrastructure stack. It uses no live prices, connects to no account, and stores nothing. What it gives you is a structural picture: where your capital sits inside the build-out, and which parts of the chain you are not touching.
What AI infrastructure portfolio exposure actually means
There is an important distinction buried in the phrase.
Owning a company is not the same as owning its AI business. Microsoft is a hyperscaler that spends enormous sums on AI data centers, but most of its revenue comes from software licences, productivity apps and gaming. If you count a 20% Microsoft position as 20% AI infrastructure exposure, you have overstated your position by a wide margin.
So the calculation here works in two steps. First, each company is assigned an estimated share of its business tied to AI data center demand. Second, that share — not the whole position — is split across the layers where the company actually operates. A 20% Microsoft holding with an estimated 30% AI-linked business produces roughly 6% AI infrastructure exposure, not 20%.
This is why the headline number is usually lower than people expect. That is the point. An honest structural map is more useful than a flattering one.
How to use it in two minutes
Type each holding’s ticker and its weight as a percentage of your portfolio. Weights do not have to add up to 100% — whatever is left over is shown as unallocated, so you can test a single sleeve of your portfolio rather than the whole thing.
Three practical notes. If your weights exceed 100%, the tool will offer to normalise them proportionally instead of making you redo the arithmetic row by row. If the same ticker appears twice, it will ask you to combine those rows first, because two entries for one company would double-count that position. And if you already keep your holdings in a spreadsheet, use Paste a list instead and drop in lines like NVDA 30 — tabs, commas and percent signs are all handled.
Everything after that is read-only. There is no submit-to-server step, so your AI infrastructure portfolio exposure is calculated and displayed entirely on your own device.
The eight layers of the AI infrastructure stack
Every AI cluster moves through the same chain: silicon is designed and fabricated, memory feeds it, packets move between racks, electricity arrives, heat leaves, and someone owns the building. Each step is a different business with different customers and a different cycle.
| Layer | What it sells | What moves demand |
|---|---|---|
| Compute Platforms | Accelerators, server CPUs, AI systems | Model training and inference budgets |
| Memory & Storage | HBM, server DRAM, nearline drives | Bandwidth per accelerator, data retention |
| Semiconductor Equipment | Lithography, deposition, etch, process control | Fab and packaging capacity additions |
| Networking & Connectivity | Switches, optics, interconnect silicon | Cluster size and topology |
| Power Equipment | Switchgear, UPS, busway, distribution | Megawatts commissioned per site |
| Cooling Infrastructure | Liquid cooling, CDUs, thermal systems | Rack density and power per rack |
| Nuclear & Grid | Generation, PPAs, transmission | Available electricity near data centers |
| Hyperscalers & Data Centers | Cloud capacity, colocation, leases | Capex budgets and lease absorption |
These layers do not move together. Memory runs on a supply cycle that can turn while compute demand is still rising — something memory investors saw first-hand this year. Cooling demand follows rack density rather than chip volume, which is why liquid cooling suppliers can grow while other semiconductor names stall. And grid capacity has become the constraint that decides how fast the rest of the stack can be deployed. According to the IEA’s Energy and AI report, global data center electricity consumption was around 415 TWh in 2024 and is set to reach roughly 945 TWh by 2030 in its Base Case — with the range across the IEA’s scenarios spanning 700 to 1,700 TWh by 2035.
Holding four companies from the same layer is a single bet wearing four names.
Why one stock belongs to more than one layer
Real businesses rarely sit in one box.
Vertiv sells both power distribution and thermal management into the same rack, so a Vertiv position lands in Power Equipment and Cooling Infrastructure. NVIDIA is a compute company that also supplies a large share of cluster networking. Super Micro assembles AI servers and, increasingly, the liquid cooling that goes with them. Forcing each company into a single layer would produce a cleaner chart and a less accurate one.
The map behind this tool therefore splits each company’s AI-linked business across layers by weight. A holding in a company that is 60% power and 40% cooling contributes to both, in proportion. Comparing two power names directly shows how different two apparently similar businesses can be once you look at where the revenue actually comes from.
How to read your result
Core exposure vs thematic exposure
Some companies disclose enough for a defensible estimate. Others do not.
Where a company reports segments that map onto AI data center demand, the estimate is labelled segment based. Where the connection is real but the numbers are not disclosed, it is thematic — and thematic holdings are reported separately from your core exposure, not blended into it.
Meta is the clearest example. It builds and operates some of the largest AI data centers in the world, but it earns its revenue from advertising. Its exposure is capital spending, not AI infrastructure revenue. Blending that into a core exposure figure would make the number look bigger and mean less.
Spenders and suppliers sit on opposite sides
Hyperscalers write the cheques. Equipment makers cash them. When capex guidance is cut, those two groups do not move the same way — the supplier loses revenue, while the spender may see margins improve.
If your result shows meaningful weight on both sides, you are exposed to the level of AI spending in one place and to the efficiency of it in another. Neither is wrong. Knowing which one you own more of is the useful part. Our hyperscaler capex work tracks the spending side of that equation.
Layers with little or no exposure
The tool lists layers where your exposure falls below 5%. That is an observation, not an instruction. A portfolio deliberately concentrated in compute is a legitimate position held on purpose. A portfolio accidentally missing the power and cooling layers — the two that currently gate deployment — is a different situation, and worth knowing about.
Three patterns that show up most often
One layer carrying almost everything
Four or five different tickers, one underlying driver — and an AI infrastructure portfolio exposure figure that looks broad while resting on a single demand cycle. This is the most common result among investors who built their AI position from headlines, because headlines cluster around compute. The chart makes it visible in a way a list of holdings does not.
Owning the spenders, not the suppliers
Portfolios built from large-cap technology names — Microsoft, Alphabet, Amazon, Meta — often show a high total AI association but low AI infrastructure revenue exposure. Those companies fund the build-out; they are not paid by it. If your thesis is that AI infrastructure spending keeps rising, holding only the spenders expresses that thesis indirectly at best.
Diversified on paper, concentrated in practice
Broad semiconductor and technology ETFs are excluded from the layer chart in this tool, because their holdings change without notice and decomposing them would create false precision. But it is worth knowing that many of them are heavily weighted toward the same compute names you may already hold directly. Which companies are genuinely exposed — and which merely trade as if they are — is a question that surfaces every time the AI trade wobbles.
What this tool will not tell you
Being explicit about the limits is part of making the output usable.
It does not value anything. No multiples, no price targets, no view on whether a layer is expensive. It does not use live market data, so your weights are the weights you typed, not today’s market values. It does not judge your allocation, rank your holdings, or suggest what to buy or sell. It does not know your time horizon, tax situation, income needs or risk tolerance — all of which matter more than any layer chart.
It also cannot see inside funds. And company business mixes shift every quarter: a company earning 20% of revenue from data centers today may earn 40% next year, which would change its position on this map.
If you want the behavioural counterpart to this structural view, the AI investor personality quiz covers how you tend to approach the same stack — the two together are more informative than either alone.
Methodology in plain language
Most companies do not publish an “AI data center revenue” line. Estimates here are built from what companies do disclose — reportable segments, end-market breakdowns, customer concentration notes and management commentary — and then rounded into broad bands rather than presented as precise figures.
Each estimate carries a confidence label. Segment based means it is derived from disclosed segments; it is still our calculation, not a company-reported AI percentage. Estimated combines segments with management commentary. Thematic reflects business character without a disclosed figure, and is shown separately.
Pre-revenue companies are excluded from the exposure math entirely and listed on their own, because a share of revenue cannot be calculated from revenue that does not yet exist. Diversified funds are counted in your portfolio total but left out of the layer chart. Tickers outside our coverage are marked unclassified rather than silently treated as zero.
The map is reviewed quarterly. If a company’s business mix has changed, treat its latest filing as authoritative. Company filings are available through SEC EDGAR, while Investor.gov’s asset allocation and diversification guide explains why holding several funds can still leave you concentrated in the same underlying companies.
Frequently asked questions
Does this tool use live stock prices?
No. It uses only the portfolio weights you type in. Nothing is fetched from a market data provider, so the result reflects your allocation rather than today’s market value.
Are my holdings saved anywhere?
No. Everything runs in your browser. There is no account, no server storage and no cookie holding your positions. Closing the tab discards the data.
Why is my AI exposure lower than I expected?
Because owning a company is not the same as owning its AI business. A large software company that spends heavily on AI data centers still earns most of its revenue elsewhere, so only the AI-linked share of that position counts toward your exposure.
Why are ETFs not broken down into layers?
Fund holdings change without notice, and decomposing them from a static map would create false precision. Funds are counted in your portfolio total and shown separately as diversified holdings.
What does thematic exposure mean?
It covers holdings whose connection to AI infrastructure is real but not backed by a disclosed revenue figure, such as a company that spends on AI data centers while earning revenue from another business. It is reported separately so it does not inflate the core estimate.
My ticker is not supported. Why?
Coverage focuses on U.S.-listed companies with direct AI infrastructure exposure, so it is deliberately narrow rather than exhaustive. Unsupported tickers are marked unclassified and excluded from the layer chart instead of being counted as zero exposure.
Is this investment advice?
No. It is a structural visualisation for educational purposes. It does not evaluate valuation or performance, does not consider your circumstances, and does not recommend any security.
For educational and informational purposes only. This is not personalized investment, tax or financial advice, a suitability assessment, or a recommendation to buy or sell any security. Exposure estimates are approximations based on company disclosures as of July 2026 and may be incomplete or out of date. U.S.-listed equities only. Ajussi Guide is not affiliated with any company or fund mentioned. Verify current filings before making any investment decision.
👉 Related: AI Infrastructure Dividend Stocks — Which layers actually pay you while you wait
👉 Related: Transformer Stocks: 5 AI Data Center Plays — which names in the power layer are actually transformer-heavy
👉 Related: Ajussi Market Desk · once you know your layer exposure, see where the market actually is today