Search for semiconductor stocks and the answer arrives as a list. Nvidia, TSMC, Micron, Broadcom, ranked by something the list rarely names. They do not run the same business. One designs chips and owns no factory. One manufactures chips designed by customers in fabs it owns. One sells memory priced on a commodity cycle. One sells the machines the others buy.
That matters more than the ranking, because the number you should look at changes with the branch. A gross margin that signals pricing power in design signals utilization in foundry. A backlog that means visibility in equipment does not exist as a disclosure in memory. Ranking four business models in one column requires a metric that means the same thing in all four, and that is harder to find than the lists suggest.
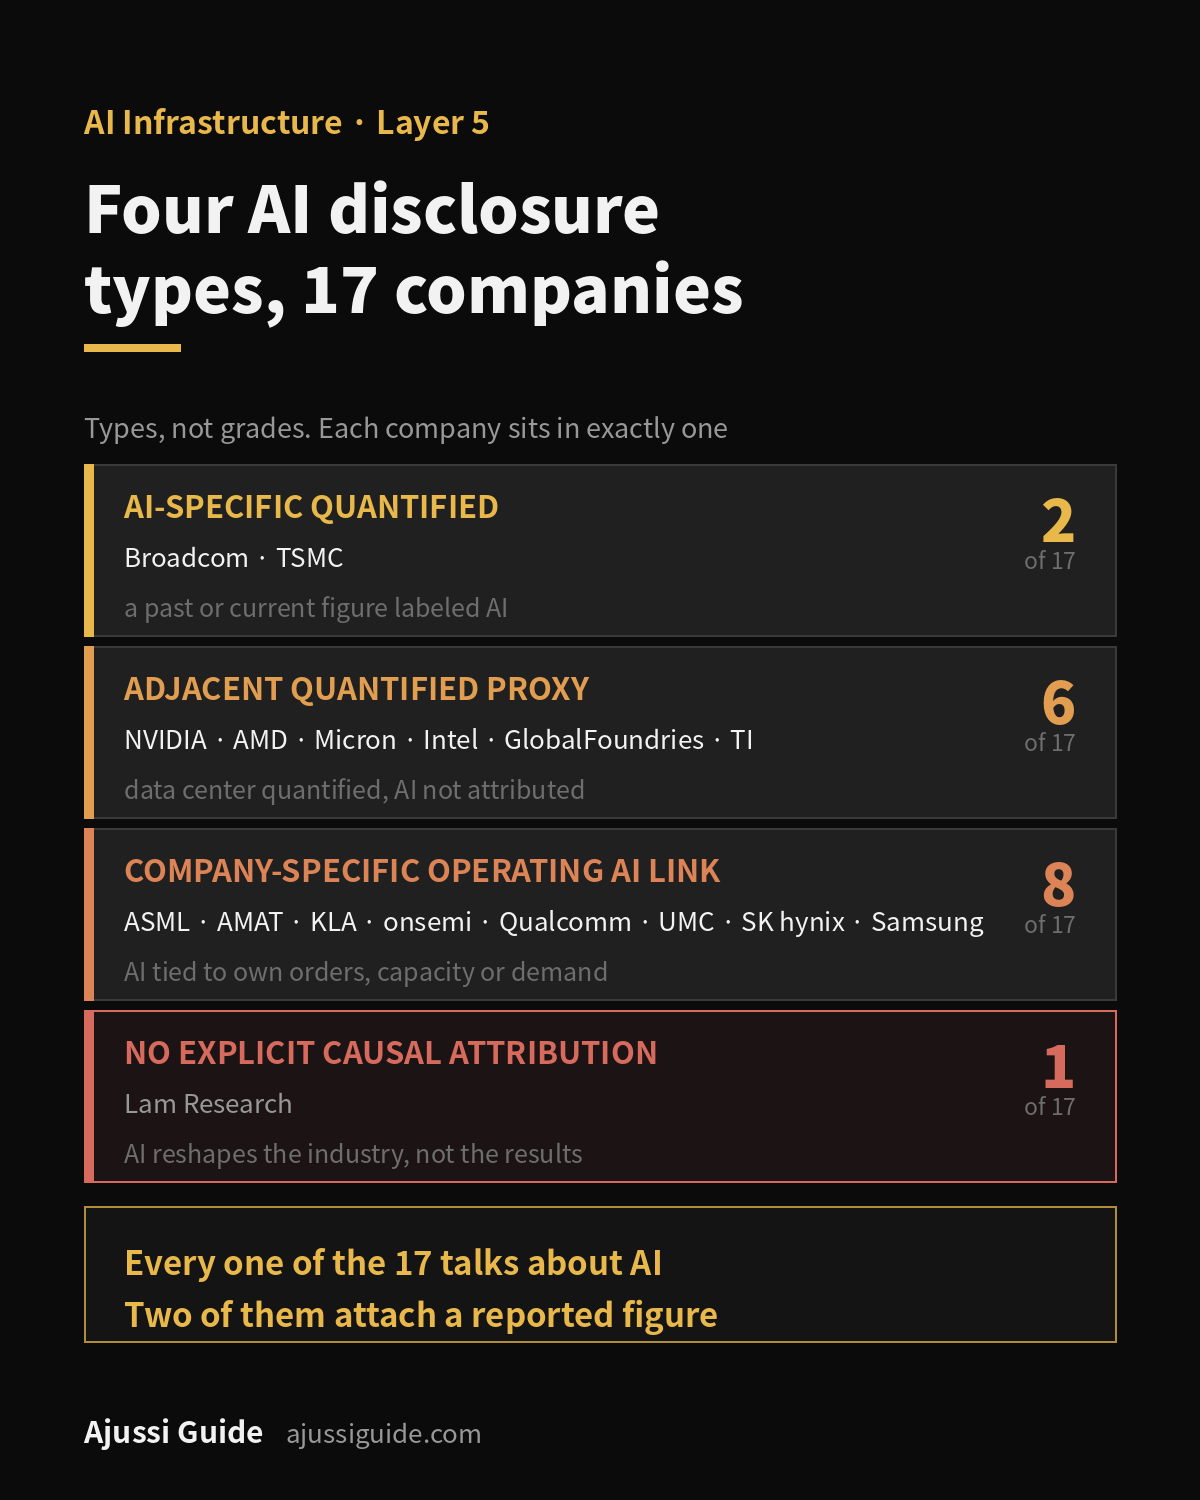
This guide splits semiconductor stocks into design, foundry, memory and equipment, and then does the part the lists skip. For seventeen listed companies it records what each one actually discloses about AI, where that disclosure lives, and what the figure covers. Across the seventeen companies, four disclosure patterns emerge. Only two report a past or current figure labeled as AI.
Where Semiconductors Sit in the AI Infrastructure Map
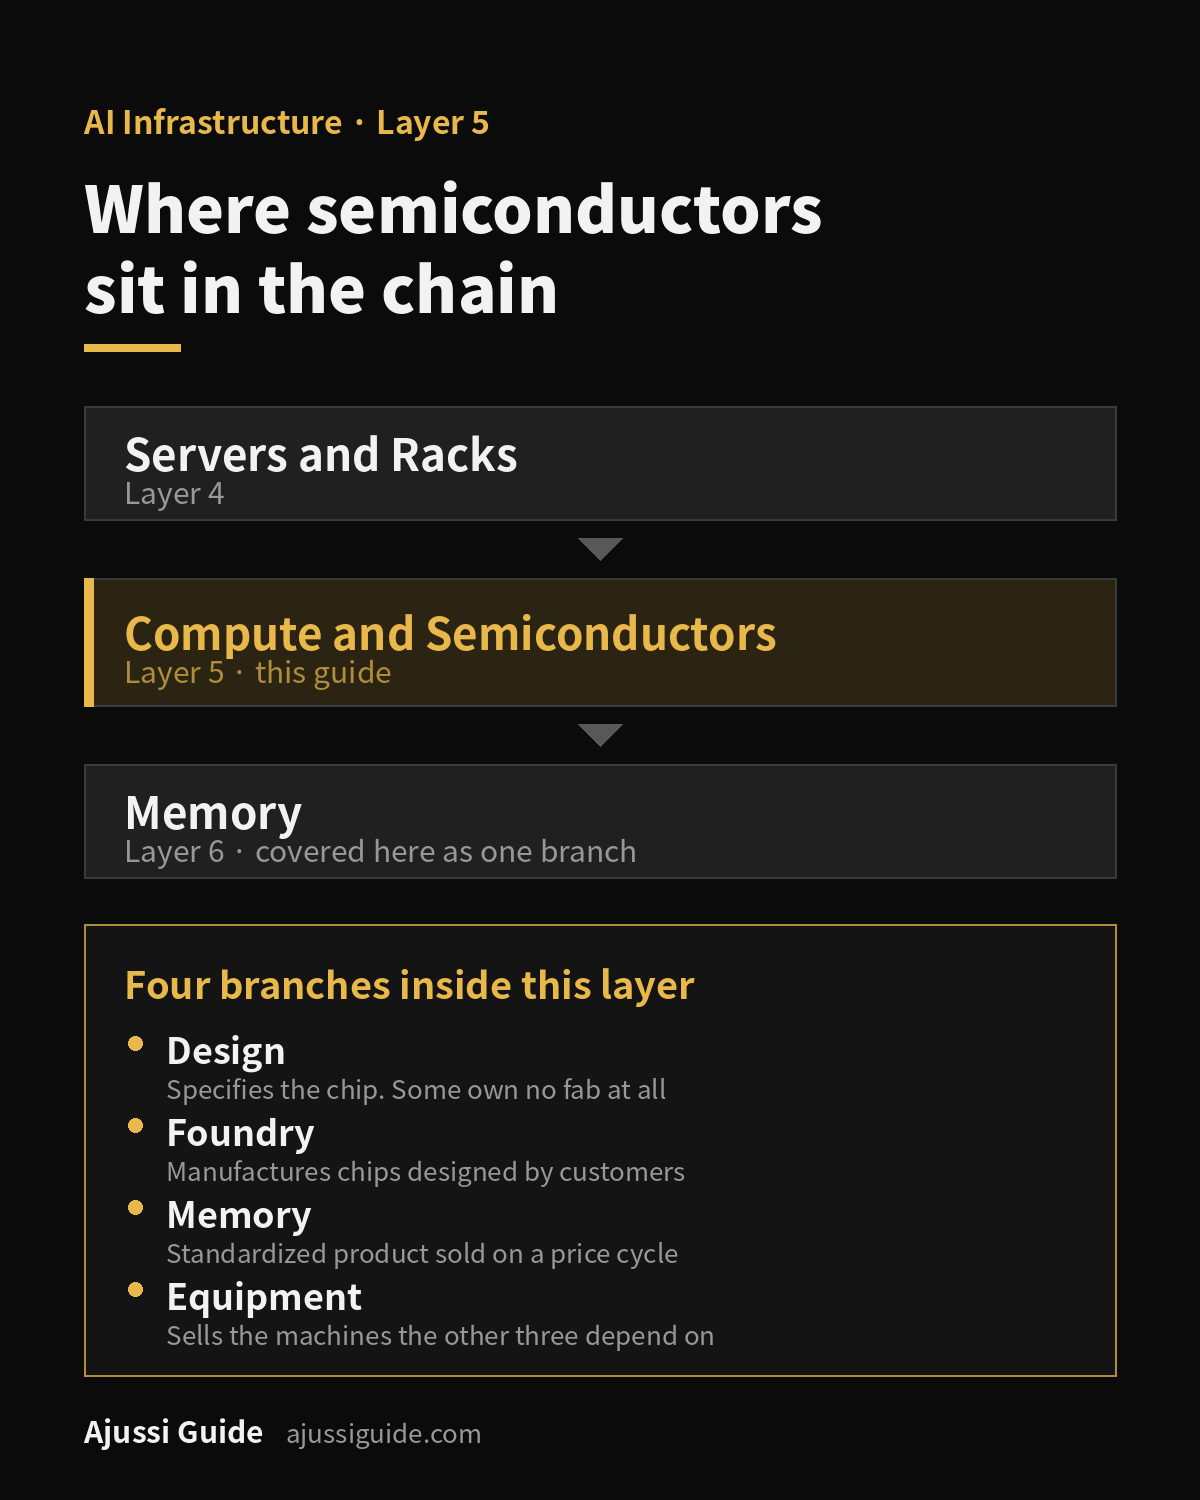
In Ajussi Guide’s seven-layer map, compute and semiconductors form the fifth layer. Power must be generated and delivered before a chip can run. Once the server runs, most of that electricity becomes heat, and the cooling layer has to remove it. Servers and racks are the box. This layer is the silicon inside the box and the industry that manufactures it.
Each layer has its own suppliers, its own cycle and its own disclosure habits. Where the electricity comes from is covered in Power Grid Stocks, how it reaches the site in Transmission and Distribution Stocks, how the heat leaves in Liquid Cooling Stocks, and who assembles the rack in Server Stocks.
Memory appears here as one of four branches rather than a separate subject, because an answer about semiconductor stocks without memory in it would not be an answer. The memory stocks guide goes deeper, comparing conventional DRAM, NAND and HBM and what each maker actually discloses.
Networking silicon comes out of the same design layer but ends up in a different product. The networking stocks guide covers switch systems, networking silicon, optical components and fiber side by side, and compares what each company reports.
The Four Branches, and Why the Split Is Not Cosmetic
Semiconductor stocks divide into four branches that differ in what they own, what they sell, and what determines whether a good quarter happens.
Design companies specify a chip and sell it. Some own no fabrication plant at all, which is what fabless means. Outsourcing manufacturing changes the shape of the cost base but does not remove manufacturing cost: wafers bought from a foundry and advanced packaging bought from a supplier both land in cost of goods sold. What changes is exposure to fab depreciation and utilization, not exposure to cost.
Foundry companies own the plants and manufacture to a customer’s design. The result is driven by utilization, the depreciation schedule of very large capital spending, and the mix of process nodes running. A foundry with idle capacity and one running flat out can report similar revenue and very different margins.
Memory companies make a standardized product sold on price. Bit shipments, average selling price and inventory move the result more than any product announcement, and the cycle is sharper than in the other three branches in both directions.
Equipment companies sell the machines that fabs install. Their demand is derived from someone else’s capital spending decision, so revenue arrives on a delay after a fab commits, and the forward indicator, where one is published, is orders or backlog rather than current revenue.
Why Gross Margin Does Not Transfer Across Branches
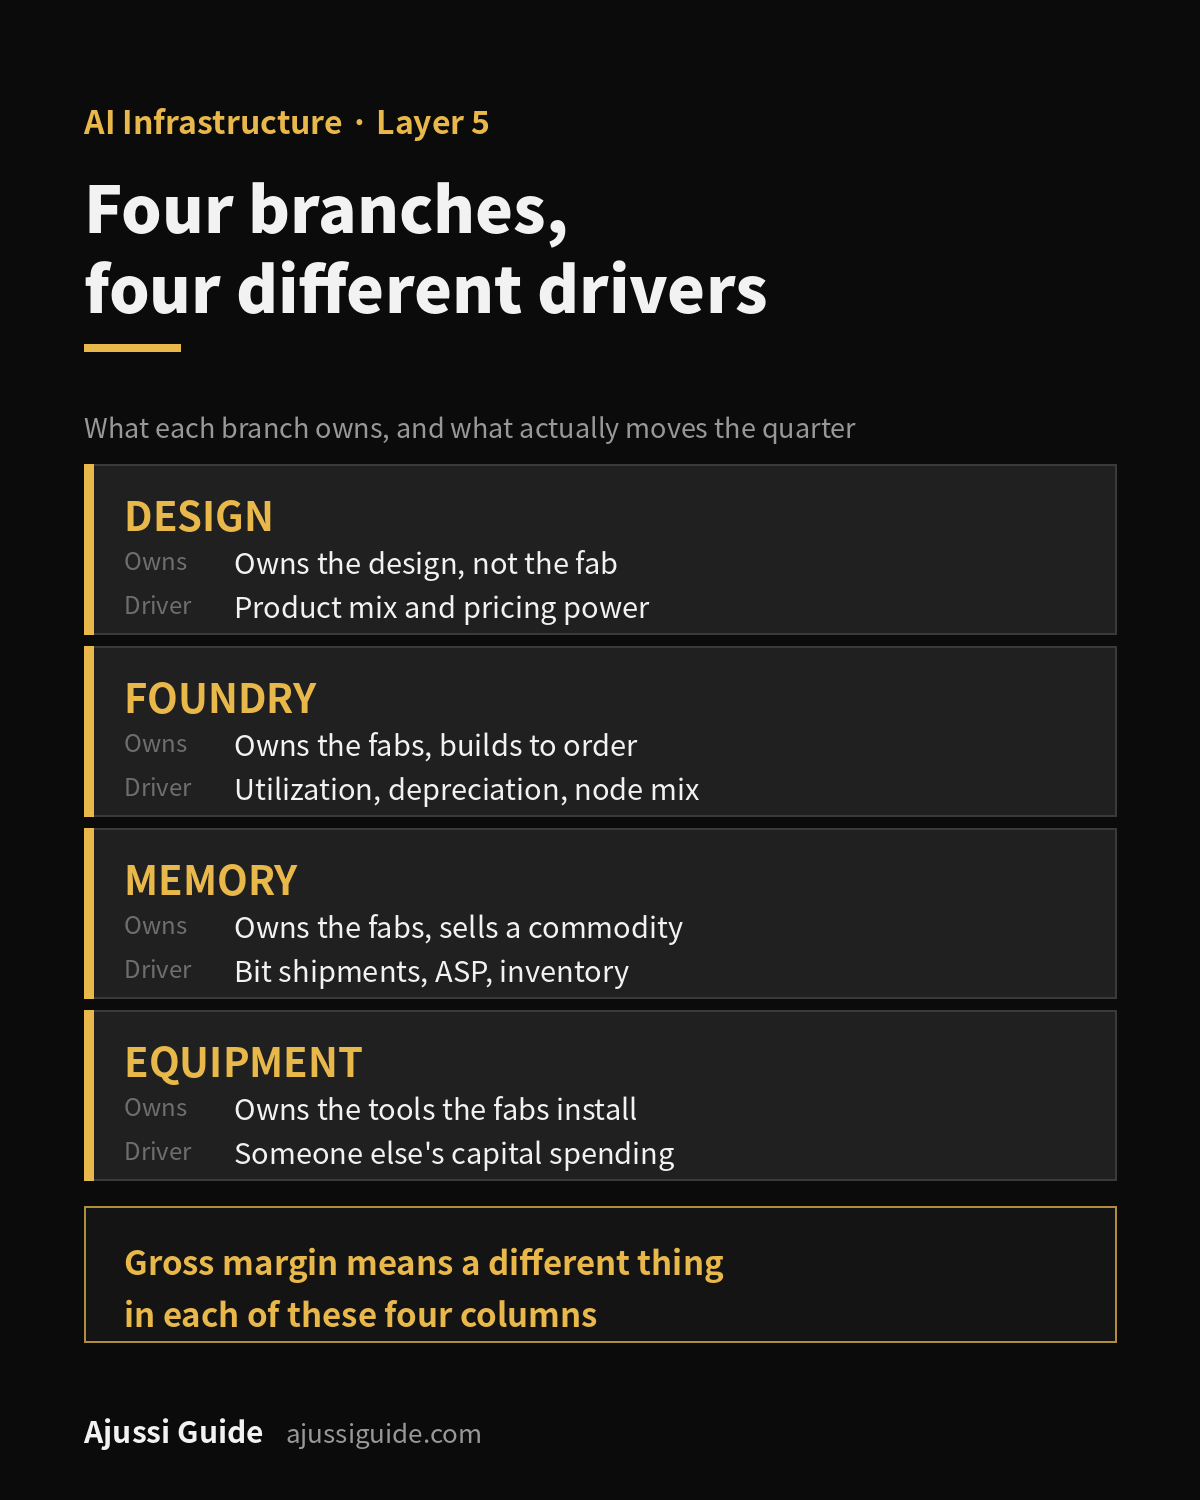
Comparison lists of semiconductor stocks put gross margin in a column and sort it. Across these four branches, the column does not hold a single meaning.
In design, it mostly reflects product mix and pricing power, because manufacturing cost is a purchased input. In foundry, it moves with utilization and with depreciation on plants built years earlier, which is why one company can print very different margins at similar revenue. In memory, it tracks a price cycle the company does not set. In equipment, it reflects the mix of new tools against installed-base service, which behave differently through a downturn.
Sorting four business models by one margin column produces a ranking, not a comparison. Compare within a branch, and across branches compare the driver rather than the number.
The Companies, by Branch
The seventeen semiconductor stocks here are grouped by branch. Role is what the company does in the supply chain, not a judgment about the business.
| Company | Branch and role |
|---|---|
| NVIDIA | DESIGN Accelerators, networking and rack-scale platforms. Overlaps the server layer. |
| AMD | DESIGN Server CPUs, accelerators, adaptive silicon. |
| Broadcom | DESIGN Custom accelerators and AI networking silicon, plus infrastructure software. |
| Qualcomm | DESIGN Handset, automotive and IoT silicon, with a stated data center roadmap. |
| TSMC | FOUNDRY Contract manufacturing across leading and mature nodes, plus advanced packaging. |
| GlobalFoundries | FOUNDRY Specialty and mature nodes, including silicon photonics. |
| UMC | FOUNDRY Mature and specialty nodes, single reportable segment. |
| Micron | MEMORY DRAM and NAND, including HBM. |
| SK hynix | MEMORY DRAM and NAND, including HBM. |
| Samsung Electronics | MEMORY FOUNDRY Memory, foundry and system LSI inside one division. |
| ASML | EQUIPMENT Lithography, including EUV. |
| Applied Materials | EQUIPMENT Deposition, etch, and installed-base services. |
| Lam Research | EQUIPMENT Deposition and etch, weighted to memory and foundry. |
| KLA | EQUIPMENT Process control and inspection. |
| Intel boundary case | DESIGN FOUNDRY Designs and manufactures its own products, and reports an Intel Foundry segment whose revenue includes intersegment transactions. |
| Texas Instruments boundary case | DESIGN Analog and embedded, sold into industrial, automotive and data center. |
| ON Semiconductor boundary case | DESIGN Power and sensing silicon, sold into automotive, industrial and AI data center power. |
Three boundary cases are kept separate for different reasons. Intel sits in two branches at once, and its foundry segment revenue includes internal transfers rather than being an external-customer figure. Texas Instruments and ON Semiconductor are here because both get grouped into AI screens on the strength of what they make, and their own filings tell two very different stories about that.
What a US Investor Can Actually Buy
The other half of the question is whether the shares are reachable, and through what instrument.
| Company | Investor access |
|---|---|
| NVIDIA · AMD · Broadcom · Qualcomm | US EXCHANGE NVDA · AMD · AVGO · QCOM |
| Micron · Intel · Texas Instruments · ON Semiconductor | US EXCHANGE MU · INTC · TXN · ON |
| Applied Materials · Lam Research · KLA | US EXCHANGE AMAT · LRCX · KLAC |
| GlobalFoundries | US EXCHANGE Nasdaq: GFS. Ordinary shares, not a depositary receipt. |
| ASML | US EXCHANGE Nasdaq: ASML. Ordinary shares registered in the US, not a depositary receipt. |
| TSMC | FOREIGN TWSE: 2330. ADR NYSE: TSM, one ADS represents five ordinary shares. |
| UMC | FOREIGN TWSE: 2303. ADR NYSE: UMC, one ADS represents five ordinary shares. |
| SK hynix | FOREIGN KRX: 000660. ADS Nasdaq: SKHY, one ADS represents one-tenth of a common share, depositary Citibank. |
| Samsung Electronics | FOREIGN KRX: 005930. GDR London. No US listing and no ADR program. |
Two access facts are commonly misreported.
SK hynix now has a regular-way US line. The prospectus dated 9 July 2026 states that each ADS represents one-tenth of a common share, trading on Nasdaq under SKHY, with Citibank as depositary. The Korean ordinary shares trade as before.
Samsung Electronics does not. Its investor relations page states that its global depositary receipts are listed in London and that individuals are prohibited from trading GDRs under Rule 144A, a restriction the page applies to US residents. There is no US listing and no ADR program.
Unofficial OTC symbols circulate for both. None was confirmed as tradable in company or exchange documents, and this guide does not treat them as an access route.
What Each Company Actually Discloses About AI
This is the part the ranking lists of semiconductor stocks leave out.
Every company here talks about AI. The useful question is not whether a company mentions it, but whether anything in its own filings lets you measure AI exposure at all. Four patterns cover all seventeen, and they are types rather than grades: a company sits in exactly one.
Disclosure types
AI-SPECIFIC QUANTIFIEDThe company labels a past or current figure as AI and gives an amount or a share.ADJACENT QUANTIFIED PROXYA neighboring market such as data center is quantified, but nothing is attributed to AI.COMPANY-SPECIFIC OPERATING AI LINKThe company ties AI directly to its own revenue, demand, orders, products or capacity expansion, without disclosing a past or current AI figure.NO EXPLICIT CAUSAL ATTRIBUTION TO OWN RESULTSAI appears, but not as a stated cause of the company’s own results.Forward-looking figures are labeled separately. A target is not a result.
| Disclosure type | Companies and what they disclose |
|---|---|
| AI-SPECIFIC QUANTIFIED 2 of 17 | Broadcom reports AI semiconductor revenue of US$10.8B, up 143% year on year, quarter ended 3 May 2026. TSMC management stated that revenue from AI accelerators was a high-teens percentage of 2025 revenue. Neither is an audited segment line. Broadcom’s audited segments are semiconductor solutions and infrastructure software; TSMC’s audited split is by platform, not by AI. |
| ADJACENT QUANTIFIED PROXY 6 of 17 | NVIDIA Data Center US$75.2B, compute US$60.4B and networking US$14.8B. AMD Data Center US$6.718B, up 107%. Micron CMBU US$13,769M and CDBU US$11,524M. Intel DCAI US$6.3B. GlobalFoundries Communications Infrastructure and Datacenter US$277M of US$1,786M. Texas Instruments data center 9% of 2025 revenue, annual, AI attribution not disclosed. |
| COMPANY-SPECIFIC OPERATING AI LINK 8 of 17 | ASML ties AI to customer commitments, to its own order intake, and to adding 30% to 2026 low-NA EUV capacity for 2027. KLA states backlog rose from US$7.86B to US$12.57B due to demand driven by the AI infrastructure buildout. Applied Materials says AI demand for its solutions led it to raise its Semiconductor Systems revenue expectations. ON Semiconductor calls AI data center its fastest-growing business and expects that revenue to more than double in 2026. Qualcomm set a data center revenue target above US$15B by fiscal 2029. UMC announced fab expansion to meet accelerating AI demand. SK hynix states AI server products led price increases. Samsung describes addressing AI demand with a server-first allocation of limited capacity. None of the eight discloses a past or current AI revenue amount or share. |
| NO EXPLICIT CAUSAL ATTRIBUTION TO OWN RESULTS 1 of 17 | Lam Research states it delivered record revenue as AI-driven demand continues to reshape the semiconductor industry. What AI is said to reshape is the industry, not Lam’s own revenue or orders. The closest call in the table. Record revenue and the AI clause sit in one sentence, so the wording is quoted rather than summarized. |
Broadcom gives a quarterly amount in dollars. TSMC gives an annual share of revenue, and did not define what it counts as an AI accelerator when it gave the figure. The two figures are not the same kind of figure.
Forward-looking figures are tracked on their own axis, because a target read as a result is the most common error here.
| Forward-looking, quantified | Forward-looking, not quantified |
|---|---|
| Broadcom, Q3 AI semiconductor revenue guidance of US$16.0B · Qualcomm, above US$15B data center revenue by FY2029 · ON Semiconductor, AI data center revenue to more than double in 2026 · ASML, 30% added low-NA EUV capacity for 2027 | Applied Materials, raised Semiconductor Systems revenue expectations for 2026, with no figure attached |
ON Semiconductor’s figure is a multiple without a denominator. The base it is doubling from is not disclosed, so it cannot be converted into an amount.
Why These AI Exposure Numbers Are Not Directly Comparable
Four figures from the source audit look alike in a table and are not alike at all. Each covers something different, and each was published in a different kind of document.
GlobalFoundries’ US$277M is end-market revenue for Communications Infrastructure and Datacenter, a category that bundles telecom infrastructure with data center and attributes nothing to AI. It appears in the 6-K financial supplement filed 5 August 2026, not in the earnings release, which gives only the US$1,786M total.
TSMC’s 66% is a platform mix figure, not a revenue amount and not an AI figure. High Performance Computing in TSMC’s definition includes non-AI CPUs, general compute and networking. It is published in the quarterly management report; the earnings release breaks revenue down by process node instead.
Micron’s data center figure above US$25B is a company measure presented by management on the earnings call, not a line in the release. The related HBM4 statement is phrased as having already shipped over one billion dollars, which is cumulative rather than quarterly.
Intel’s US$293M is narrower than it looks. The 10-Q filed 24 July 2026 describes it as certain third-party foundry and assembly and test revenues from external customers. It is not defined as total external foundry revenue, so the gap to the US$5.8B Intel Foundry segment cannot be read as internal transactions.
All four are official primary sources. None of them is an audited segment revenue line, and where a figure sits does not rank how much to trust it. What it changes is what the figure covers, and that is what has to travel with the number.
From Announcement to Production
Capital expenditure announcements, groundbreaking, tool move-in and volume production are four separate events, and years can separate the first from the last. AI demand statements cluster at the announcement end.
The useful discipline is to ask which stage a figure describes. A fab expansion release describes intent. An equipment order is a customer commitment. Backlog is committed work not yet delivered. Revenue is work recognized. UMC announcing expansion for AI demand and KLA reporting backlog up US$4.7B are both real, and sit at different points on that line.
Equipment is where the distinction is most visible, and also where disclosure is least consistent. ASML omitted a numeric net bookings line from the first- and second-quarter releases reviewed here, while still discussing order intake in words. Applied Materials and KLA disclose backlog in annual filings rather than the current quarterly releases. No backlog figure was found in Lam Research’s 2021 to 2026 10-K filings or its latest earnings release.
Two of the four equipment companies disclose backlog annually. ASML used qualitative order-intake language in the quarterly releases reviewed here, while Lam disclosed no backlog figure in the filings reviewed.
The Risks
Four risks apply to semiconductor stocks across this layer regardless of branch.
Cycle risk is the first and the least respected. Memory has a history of moving from record profitability to losses within a small number of quarters, and capacity added at the top of a cycle arrives after it. Equipment demand turns after the fabs do, in both directions.
Customer concentration is the second. A small number of hyperscale buyers and leading-edge foundry customers can move a quarterly result either way, and the companies here generally do not name them.
Capital intensity is the third. Foundry, memory and integrated device manufacturers commit very large amounts years before revenue arrives, and the resulting depreciation lands whether or not demand held up. That is structural, not temporary.
Disclosure risk is the fourth, and it is specific to this subject. Where no AI-attributed figure is published, an AI thesis about that company rests on inference. That is not automatically wrong, but it is inference rather than a reported result.
What to Check, Branch by Branch
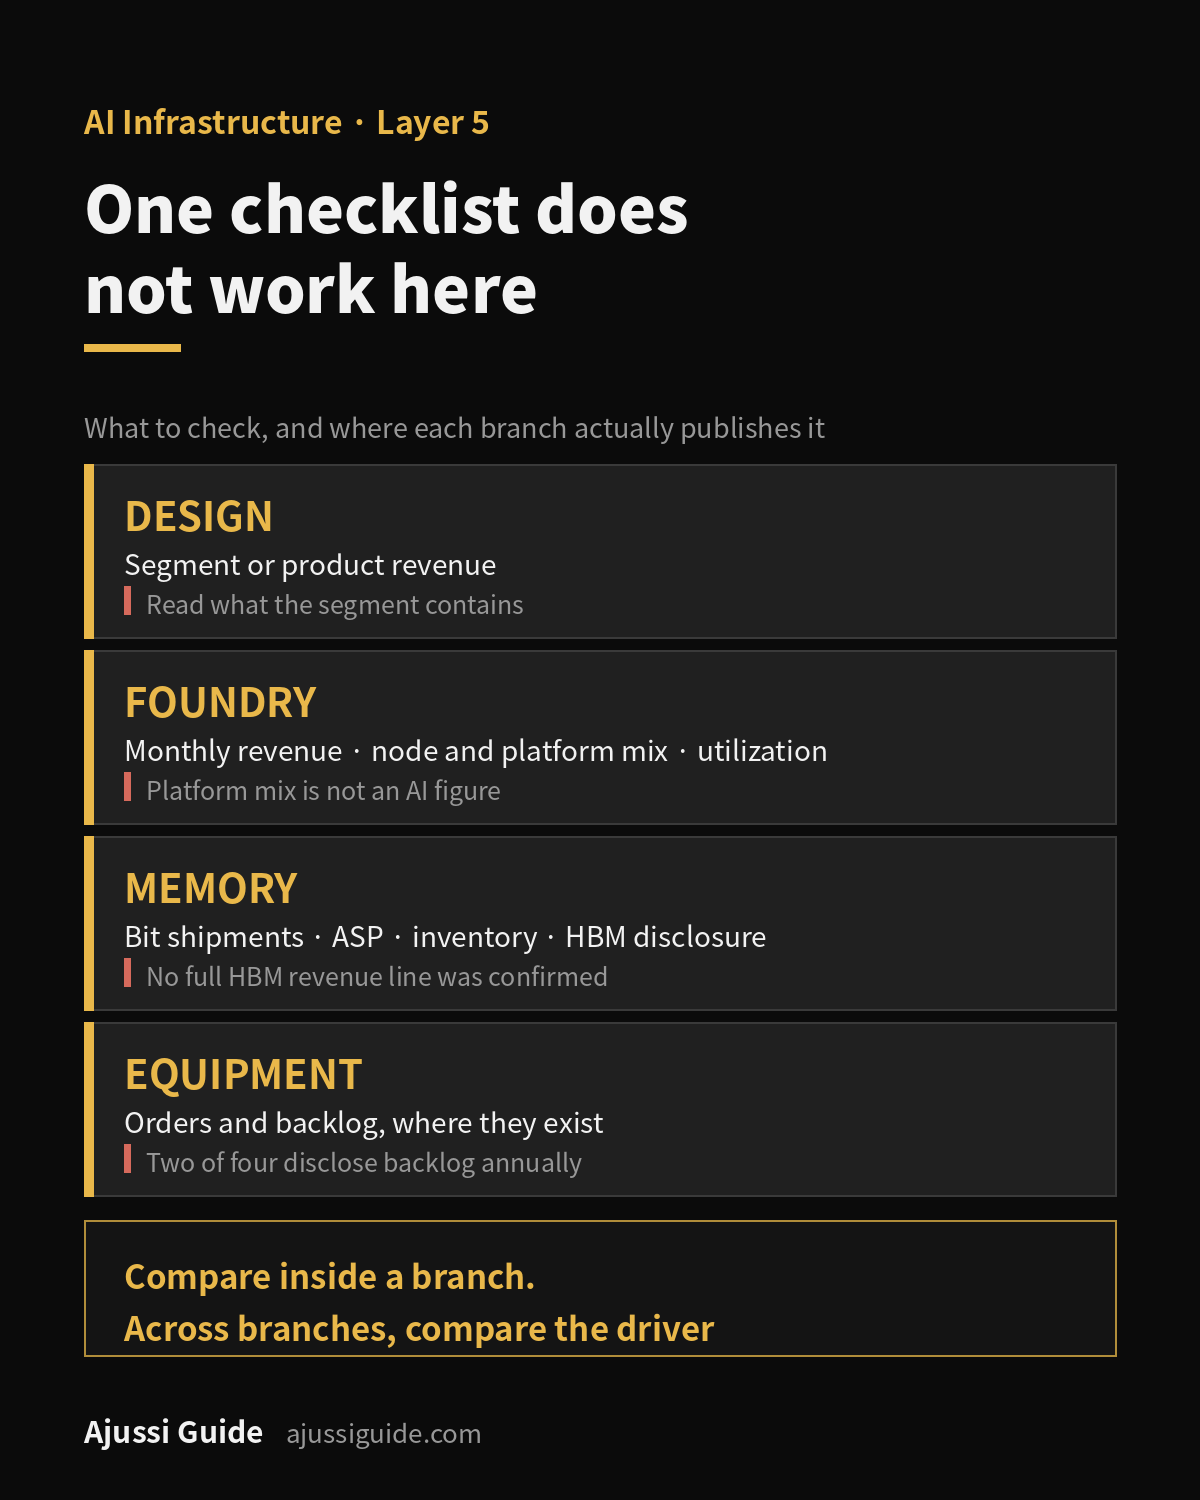
One checklist does not work across semiconductor stocks, because the branches do not publish the same things.
For design, track the disclosed segment or product revenue and read what the segment contains. AMD’s Data Center segment includes server CPUs, GPUs, APUs, DPUs, AI NICs, FPGAs and adaptive SoCs by the company’s own definition, so it is not an accelerator number. NVIDIA’s Data Center is a market classification, not a product one, and the phrase AI revenue does not appear in its release.
For foundry, monthly and quarterly revenue, platform and node mix, utilization, and progress on announced capacity. Watch whether platform mix is being read as an AI figure; it is not.
For memory, bit shipments, average selling price, inventory, and whether HBM is disclosed as revenue or only described. Among the three here, no full HBM revenue figure with its share of total revenue was confirmed. Micron gives a cumulative figure for one generation.
For equipment, orders and backlog where they exist, and the mix of new systems against installed-base service. Check the format before assuming continuity between quarters.
Across all four, compare revenue growth against operating cash flow, receivables and inventory to see whether growth is converting into cash or accumulating in working capital.
Related Research
Semiconductor stocks are the fifth layer of seven, and the layers around them are linked in the map section above. Every guide on this site is listed on the site map.
Frequently Asked Questions
How should semiconductor stocks be compared across design, foundry, memory and equipment?
Compare within a branch, and compare drivers across branches. The same metric carries different meaning in each: gross margin reflects product mix in design, utilization and depreciation in foundry, a price cycle in memory, and new-tool versus service mix in equipment. Compare what moves the result rather than the number.
Why do top-five semiconductor company lists keep changing?
Because the sorting basis changes and is often not stated. Market capitalization, revenue, segment revenue and share price return produce different orders, and the as-of date matters in a sector this volatile. Check what a ranking sorted on, and when.
Are semiconductors still a good investment?
This site does not recommend buying or selling. What can be said is that the branches do not move together. Memory is the most cyclical, equipment turns after fab capital spending decisions, foundry carries the heaviest depreciation, and design carries the least fab ownership and depreciation exposure. Cycle position is checked in the disclosures listed above, not in the AI narrative.
Does being classified as a semiconductor company mean meaningful AI exposure?
No. Texas Instruments discloses data center as 9% of 2025 revenue and never attributes revenue to AI at all: in its 2025 annual report the term appears once, in a cybersecurity risk factor. ON Semiconductor calls AI data center its fastest-growing business but does not disclose its size. Two companies with similar profiles, two entirely different disclosure situations.
Why does gross margin mean different things across design, foundry and memory?
Because the cost base differs. A fabless designer buys wafers and packaging, so those costs are in cost of goods sold, but fab depreciation and utilization are not. A foundry carries both, which is why its margin swings with how full the plants are. A memory maker’s margin moves with a price cycle it does not set. The same percentage describes three different situations.
How do you distinguish a fab capacity announcement from actual production?
By asking which event the figure describes. An expansion announcement is intent. An equipment order is a customer commitment. Backlog is committed work not yet delivered. Revenue is work recognized. Years can separate the first from the last, and AI-related statements cluster at the announcement end.
Where can investors verify whether AI demand is converting into reported revenue?
In each branch’s own disclosures, which differ. Design publishes segment and product revenue. Foundry publishes monthly revenue, platform and node mix, and utilization. Memory publishes bit shipments, pricing direction and inventory. Equipment publishes orders or backlog where it publishes them at all. Where a company does not disclose the relevant figure, the correct entry is not disclosed, rather than an estimate. Memory price indices generally require external data and are kept out of the primary-source table above.
Sources and Update Log
Last verified: 19 August 2026
If you would rather hold the theme through a fund than pick names, the AI semiconductor ETF comparison maps the dedicated and broad options.
Every figure comes from a company’s own release, filing, investor presentation or earnings transcript, linked inline, and is labeled by what it is: a reported result, a management-presented measure, or a forward-looking target. Where a company discloses no AI-attributed figure, this guide records that. No estimate is substituted.
This guide describes industry structure and disclosure practice. It does not recommend buying or selling any security.