If you are running a GE Vernova vs Siemens Energy comparison, the two companies look almost designed for a side-by-side table. Both sell gas turbines. Both sell grid equipment. Both own a wind business that has been losing money. Both just reported a quarter that ended on the same day.
And that is exactly where the comparison goes wrong. I lined up both sets of primary filings. There are five places where the numbers carry different labels, definitions, or units, so putting them next to each other produces a wrong answer. Line those up first, and one real divergence shows through: the wind businesses moved in opposite directions.
Both companies reported the same three months. The quarter numbers do not match
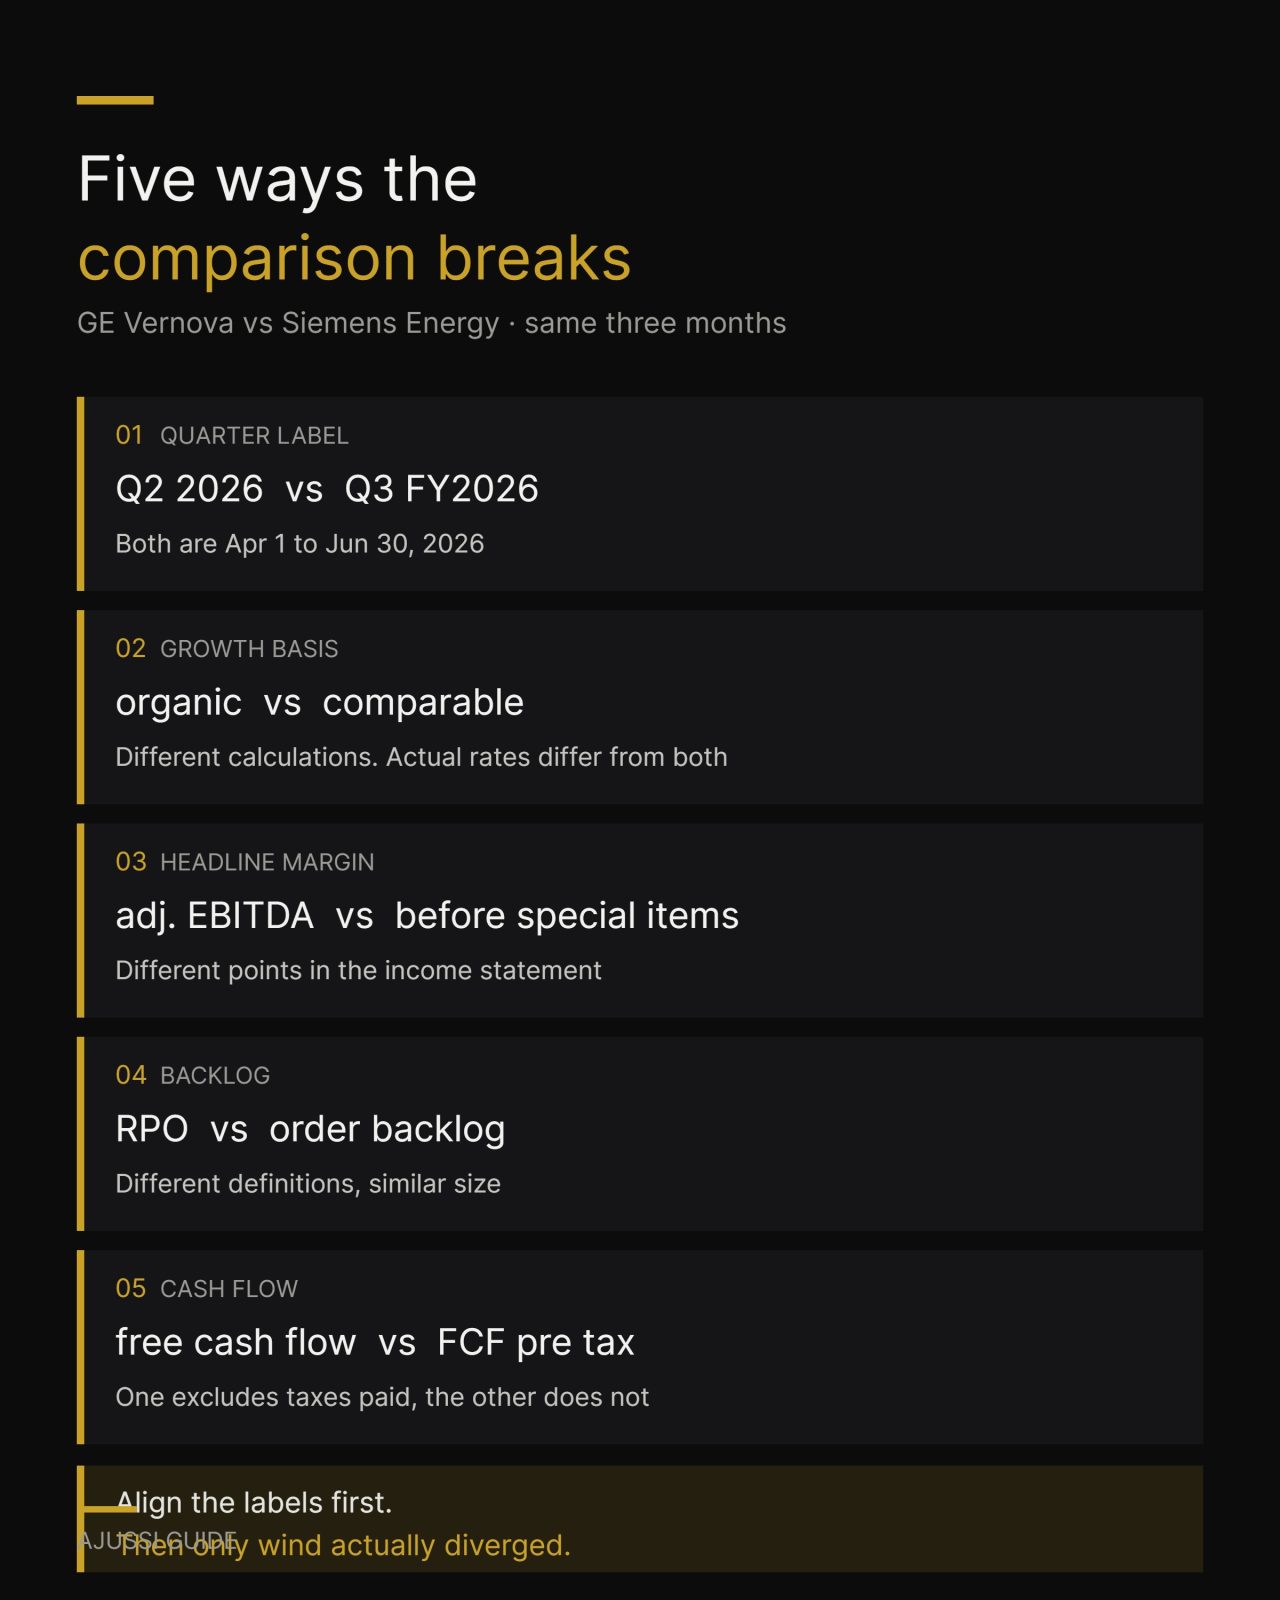
GE Vernova reported Q2 2026. Siemens Energy reported Q3 FY2026. Same period: April 1 to June 30, 2026.
Siemens Energy runs a fiscal year ending September 30, so its third quarter is GE Vernova’s second. Any GE Vernova vs Siemens Energy table that prints “Q2” against “Q3” without the dates reads like two different periods. Anchor to the period end date, not the quarter label.
GE Vernova vs Siemens Energy: the group numbers, with dates attached
| GE Vernova | Siemens Energy | |
|---|---|---|
| Period | Q2 2026 (Apr 1 to Jun 30, 2026) | Q3 FY2026 (Apr 1 to Jun 30, 2026) |
| Reporting currency | USD | EUR |
| Orders | $24.2B, +88% organic | €17,926M, +8.5% comparable (+7.9% actual) |
| Revenue | $11,104M, +22% actual, +12% organic | €11,447M, +17.5% actual, +18.5% comparable |
| Backlog | $176B (remaining performance obligation) | €162B (order backlog) |
| Book-to-bill | — | 1.57 |
| Net income (consolidated) | $649M | €1,188M |
| Cash flow | $5,107M free cash flow | €2,319M free cash flow pre tax |
Note the growth-rate labels. GE Vernova reports “organic” growth, which strips out acquisitions, dispositions, and currency including translation and transaction effects. Siemens Energy reports “comparable” growth, which strips out currency translation and portfolio effects. The intent is similar; the calculations are not identical. They should never sit in the same column without a tag.
Segment by segment, on a single growth basis
Below, every GE Vernova growth rate is organic and every Siemens Energy growth rate is comparable, matching how each company frames its own results. Actual (nominal) rates differ, sometimes sharply.
| GE Vernova segment | Orders (organic) | Revenue (organic) | Segment EBITDA margin |
|---|---|---|---|
| Power | $16,729M, +134% | $5,477M, +14% | 18.8%, +240 bps |
| Electrification | $6,347M, +66% | $3,637M, +29% | 18.4%, +390 bps |
| Wind | $1,249M, −40% | $2,026M, −11% | −13.6%, −630 bps |
| Siemens Energy segment | Orders (comparable) | Revenue | Margin before special items | Backlog |
|---|---|---|---|---|
| Gas Services | €9,967M, +61.9% | €3,756M | 17.3% | €73B |
| Grid Technologies | €5,367M, +27.6% | €3,624M | 19.9% | €51B |
| Transformation of Industry | €1,809M, +31.5% | €1,527M | 14.3% | €8B |
| Siemens Gamesa | €1,050M, −77.0% | €2,743M | +2.7% | €31B |
The grid businesses are the closest thing to a like-for-like pair, and both run at similar profitability: GE Vernova Electrification at 18.4% segment EBITDA margin, Siemens Energy Grid Technologies at 19.9% margin before special items. Note that even here the two margin labels are different measures. Both companies name data centers as a driver. GE Vernova reported over $5 billion of data center orders year to date, more than double its 2025 total. Siemens Energy attributes part of its record Gas Services intake to large US data center orders and cites data center projects in the transformer business.
The headline margins are not the same measure
This is where a GE Vernova vs Siemens Energy table does the most damage, because both figures look like profitability and neither is comparable.
| Headline margin | What it actually is | |
|---|---|---|
| GE Vernova | 11.3% | Adjusted EBITDA margin. Excludes all depreciation and amortization plus restructuring, separation costs, gains and losses on business interests, non-operating benefit income, interest, and tax |
| Siemens Energy | 14.2% | Profit margin before special items. Profit before financial result and income taxes, adjusted for amortization of intangibles acquired in business combinations, goodwill impairment, and company-defined special items |
Siemens Energy’s own reconciliation makes the distance visible: profit before special items €1,623M, profit €1,564M, EBIT €1,515M, EBITDA €1,920M. The 14.2% figure is not an EBITDA margin, and GE Vernova’s 11.3% is.
If you want a comparison that survives scrutiny, drop to the statutory bottom line on a matched basis. On consolidated net income, GE Vernova was 5.8% ($649M on $11,104M) and Siemens Energy about 10.4% (€1,188M on €11,447M). That is closer to like-for-like than the headline margins, though it still does not remove the difference between US GAAP and IFRS.
One caveat on GE Vernova’s figures: its six-month net income of $5,398M includes a pre-tax gain of $3,992M from remeasuring its previously held stake in Prolec GE. The second-quarter figure of $649M is the cleaner number for run-rate purposes.
The two backlogs are different objects
GE Vernova reports $176 billion, defined as remaining performance obligation, an accounting construct. Siemens Energy reports €162 billion of order backlog, a company-defined measure. Close enough in size to invite a direct comparison, different enough in definition that the comparison means little.
The more informative detail sits one level down, where the units are unambiguous. GE Vernova ended the quarter with gas equipment backlog and slot reservation agreements at 116 GW, up from 100 GW, and expects at least 125 GW under contract by year-end 2026. Its gas equipment backlog alone moved from 44 to 53 GW. That is capacity, not currency, and it needs no translating.
Both companies sit inside the same equipment bottleneck. If you are working through who else supplies that chain, I mapped the listed names in transformer stocks for AI data centers.
The cash flow figures are not the same measure either
GE Vernova reported free cash flow of $5,107M. Siemens Energy reported free cash flow pre tax of €2,319M. These are not the same construction.
| Measure | Definition | |
|---|---|---|
| GE Vernova | Free cash flow | Cash from operating activities less gross additions to property, plant, equipment and internal-use software. Taxes already paid are inside it |
| Siemens Energy | Free cash flow pre tax | A pre-tax measure. Siemens Energy also reports free cash flow of €2,111M for the same quarter |
Both quarters were also helped by the same mechanism. GE Vernova attributes its increase primarily to higher positive benefits from working capital and stronger adjusted EBITDA. Siemens Energy attributes its increase largely to cash-effective profit improvement, further supported by customer advance payments including reservation fees tied to higher order intake. Strong order books pull cash forward in both cases, which is worth remembering before extrapolating either quarter.
Currency, and the accounting frameworks behind it
GE Vernova reports in USD and trades on the NYSE. Siemens Energy reports in EUR and is listed in Frankfurt. Converting one set of figures into the other requires choosing an exchange rate date, and that choice moves the answer. Comparing growth rates and margins, which are currency-neutral, is cleaner than comparing absolute amounts.
Underneath that sits a second-order caution: GE Vernova reports under US GAAP and Siemens Energy under IFRS. Revenue for both is recognized on customer contracts and is broadly comparable, but treatments of development cost capitalization, leases, and provisions can differ and can affect reported margins. That is a reason to be careful, not an explanation for this quarter’s gap. Nothing in either filing supports attributing the margin difference to accounting standards.
With the labels aligned, one real divergence shows through
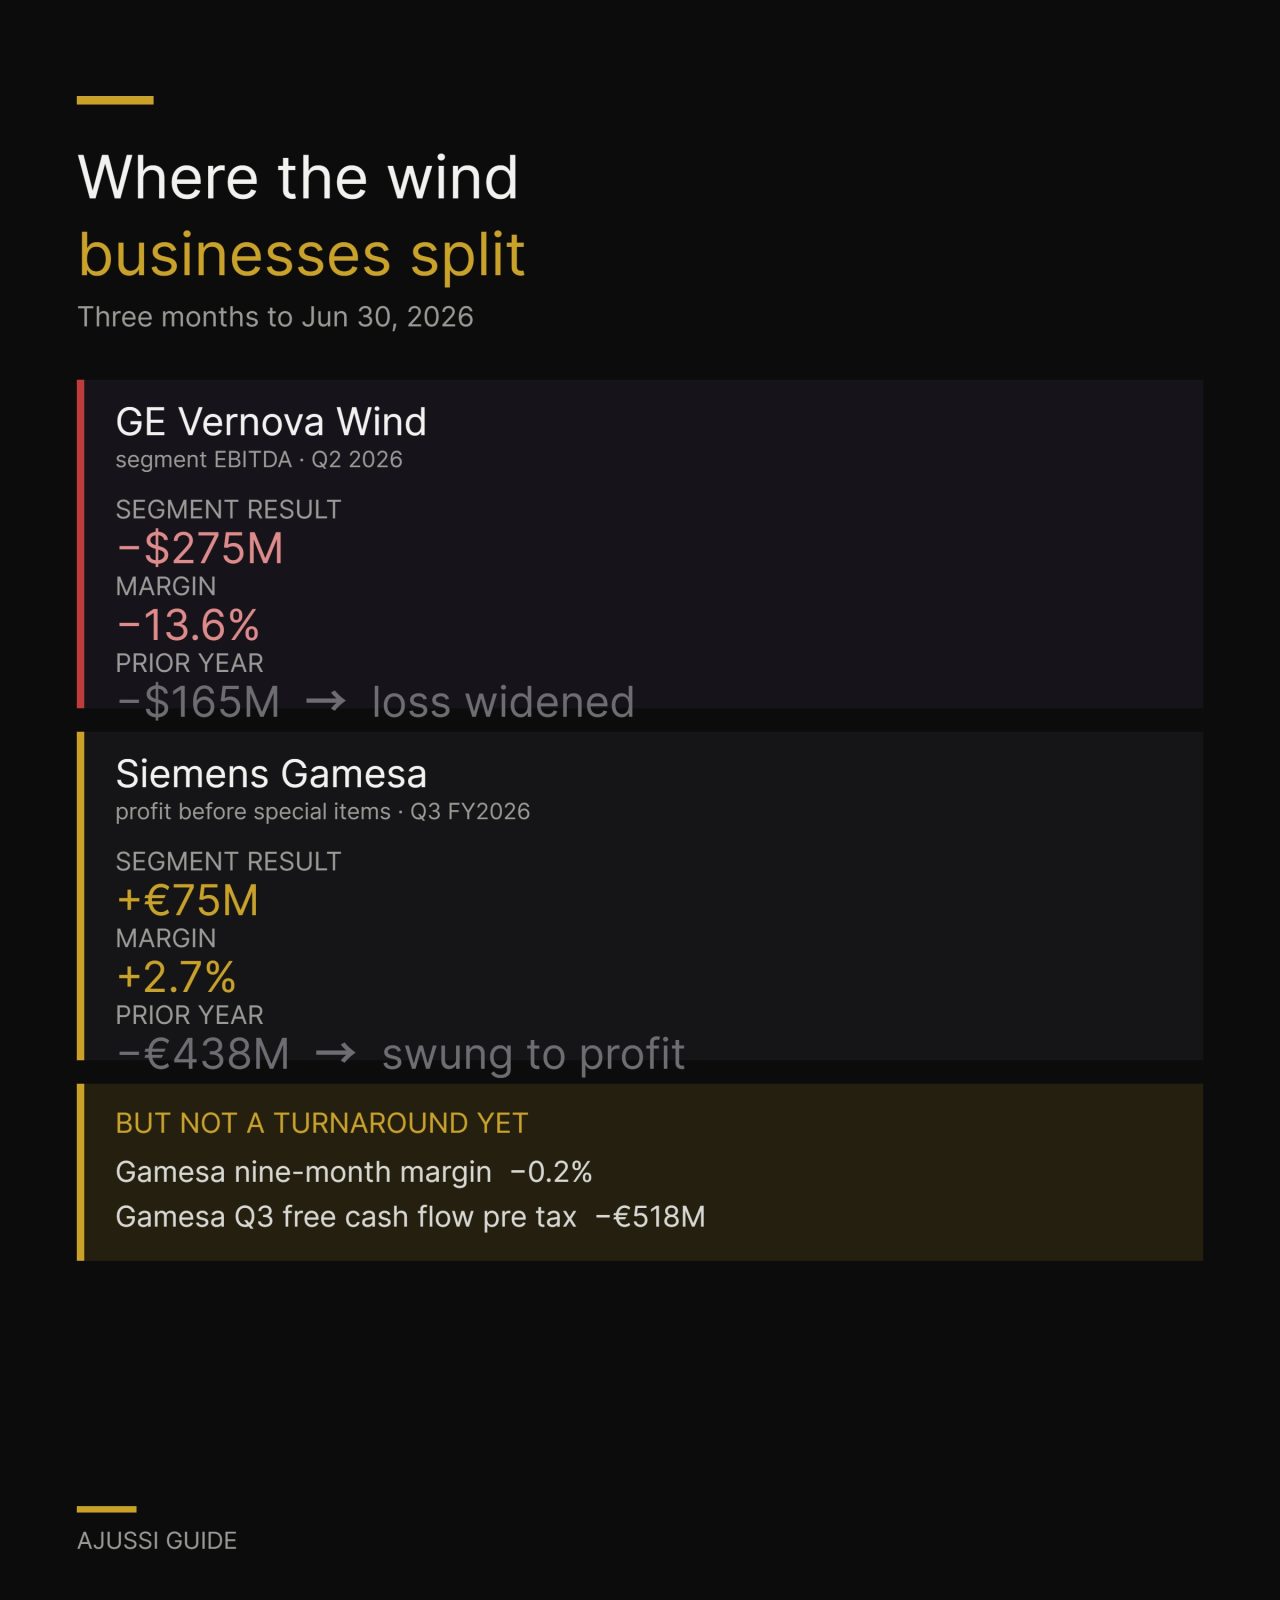
For two years the shorthand has been that both companies were dragging a loss-making wind unit toward break-even. In the quarter ending June 30, 2026, they moved in opposite directions.
| GE Vernova Wind | Siemens Gamesa | |
|---|---|---|
| Segment result | −$275M (segment EBITDA) | +€75M (profit before special items) |
| Margin | −13.6% | +2.7% |
| Prior-year quarter | −$165M, so the loss widened | −€438M, so it swung to profit |
| Orders | $1,249M, −40% organic | €1,050M, −77.0% comparable |
Siemens Energy’s CEO stated it plainly: the wind business returned to profitability in a quarter for the first time since 2022. GE Vernova’s Wind segment went the other way, with losses widening on lower onshore equipment deliveries and higher offshore project costs.
Three cautions before anyone reads a trend into this. First, Siemens Gamesa’s 77% order decline is a base effect: the prior-year quarter contained two offshore orders worth more than €3 billion and this quarter had no comparable intake. Second, the nine-month picture is still negative, with a margin before special items of −0.2% and free cash flow pre tax of −€1,717M for the first three quarters; the segment’s own free cash flow pre tax in this quarter was −€518M even as its profit turned positive. Profit improvement and cash normalization are separate things.
Third, one profitable quarter is not a completed turnaround. Siemens Energy describes Gamesa as on track to reach break-even for 2026, and its full-year segment guidance is a margin at break-even, not a profit. GE Vernova guides Wind to roughly $400 million of segment EBITDA losses for 2026 with organic revenue down low double digits. Neither company is claiming wind is fixed.
What the GE Vernova vs Siemens Energy filings actually support
Read as a bundle rather than as a scoreboard, a GE Vernova vs Siemens Energy reading supports a narrow set of statements and not much more.
- Grid equipment is the strongest shared story. GE Vernova Electrification at 18.4% segment EBITDA margin with a $40.6B equipment backlog, up 69% year over year; Siemens Energy Grid Technologies at 19.9% margin before special items with a €51B backlog. Both name data centers.
- Gas is where order growth is concentrated. GE Vernova Power orders +134% organic; Siemens Energy Gas Services orders +61.9% comparable with a book-to-bill of 2.65.
- The wind stories have separated this quarter. One swung to a quarterly profit; the other did not.
- Both raised or confirmed guidance. GE Vernova lifted 2026 revenue to $45.5–46.5B and free cash flow to $11.5–12.5B. Siemens Energy confirmed FY2026 and expects margin toward the upper end of 10–12%.
What you cannot conclude from these filings
- You cannot rank them on the headline margins. Different measures at different points in the income statement.
- You cannot mix growth bases. Organic and comparable are not the same calculation, and actual rates differ from both.
- You cannot read the backlogs as the same quantity. RPO and order backlog are defined differently.
- You cannot compare the cash flow headlines directly. One is pre tax, the other is not.
- You cannot call the wind divergence a trend. One quarter, with a large base effect on the Siemens Gamesa order line and negative nine-month cash flow behind it.
- You cannot get valuation from any of this. Nothing here covers share price, multiples, or dividend yield.
Neither name is the whole trade. The wider set of listed companies feeding grid and generation demand is laid out in AI power infrastructure stocks.
One live example of where future large-frame orders may come from: the GW Ranch project in Pecos County, whose site Amazon confirmed acquiring for a data center campus, lists 21 Siemens SGT-800s in its air permit and leaves 14 large-frame units to be selected from four allowable options, including GE Vernova’s 7HA.03 and Siemens Energy’s SGT6-9000HL. A permit filing is not a purchase contract; we track the details in our Amazon off-grid data center note.
Risks each company puts in writing
Siemens Energy states explicitly that its FY2026 outlook does not include charges related to any future legal and regulatory matters. That is a disclosed carve-out, not an estimate, and it sits outside the guidance ranges quoted above.
Both companies are also expanding production capacity into a demand surge, which is its own execution risk. Siemens Energy notes that its revenue growth was supported by expanded production capacity; GE Vernova is committing $6 billion of capital expenditure from 2025 through 2028 to raise output, with gas turbine capacity targeted at 20 GW annually in the third quarter of 2026, 24 GW in 2028, and actions underway toward 30 GW in 2030. Capacity ramps of that size carry quality and schedule exposure that neither filing quantifies for the quarter.
Frequently asked questions
Are GE Vernova and Siemens Energy reporting the same quarter?
A GE Vernova vs Siemens Energy comparison has to start here. They report the same three months but label them differently. GE Vernova calls it Q2 2026; Siemens Energy calls it Q3 FY2026 because its fiscal year ends September 30. Both periods run April 1 to June 30, 2026.
Which one has the bigger backlog?
GE Vernova reports $176B of remaining performance obligation; Siemens Energy reports €162B of order backlog. The figures are close in size but defined differently, so the comparison does not establish which order book is larger in any strict sense.
Why do the growth rates change depending on where I look?
Because each company publishes two sets. GE Vernova reports actual and organic; Siemens Energy reports actual and comparable. The gaps can be large: GE Vernova Electrification orders rose 93% actual but 66% organic, and revenue rose 68% actual but 29% organic, mainly because of the Prolec GE acquisition. Always check which basis a figure is quoted on.
Is Siemens Gamesa fixed?
It posted a profit before special items of €75M in the quarter, its first positive quarterly result since fiscal 2022. But the nine-month margin is still −0.2%, and the segment’s free cash flow pre tax was −€518M in the same quarter. Siemens Energy describes it as on track to reach break-even for 2026, and full-year segment guidance is a margin at break-even. One profitable quarter is not a completed turnaround.
Which company benefits more from AI data center demand?
Both name it explicitly. GE Vernova reported over $5B of data center orders year to date, more than double its 2025 total, and its Electrification equipment backlog rose 69% to $40.6B. Siemens Energy attributes part of its record Gas Services intake to large US data center orders and cites data center projects in the Grid Technologies transformer business. Neither filing breaks out data center revenue, so the exposure cannot be sized precisely.
Does the currency difference matter for a US investor?
GE Vernova reports in USD and trades on the NYSE. Siemens Energy reports in EUR and is listed in Frankfurt. Converting requires choosing an exchange rate date, and that choice moves the answer. Comparing growth rates and margins, which are currency-neutral, is cleaner than comparing absolute amounts.
Figures verified against primary sources as of August 9, 2026. Next update: late October 2026, when both companies report the September quarter. Sources: GE Vernova investor relations (Q2 2026 earnings release, July 22, 2026) and Siemens Energy Earnings Release Q3 FY 2026 (August 5, 2026). This article is information, not investment advice.