Short answer on Gemini stock analysis prompts: I ran three of the viral eight with real tickers and checked the key figures against primary sources. The recent Apple quarterlies were almost perfect, and the Tesla share price was accurate, but it came paired with a market-cap range of $1.5-1.8 trillion when the quoted price implies about $1.31 trillion. Three dividend streak counts ran two to nine years long, and the screen’s top pick led the table on a streak the company had already ended.
A Korean-language thread post has been circulating since mid-2025: eight copy-paste prompts for analyzing US stocks and ETFs with Gemini, promising “reliable data sources and clear numerical grounding.” It has the engagement numbers that make people paste first and check later. So I checked.
What the viral Gemini stock analysis prompts promise
The set covers ETF comparisons, financial statement summaries, valuation workups, dividend screens, and macro event playbooks. Each prompt tells Gemini exactly which sources to cite: SEC filings, company IR pages, GuruFocus, Simply Safe Dividends, and so on. That instruction is the selling point. It reads like a guardrail against hallucination.
The post dates from June 2025. I ran the Gemini stock analysis prompts on August 11, 2026, in a signed-in Gemini web session. The account displayed Google One Pro, the model selector showed Flash, and no model settings were changed. Each prompt went into a fresh chat, pasted verbatim.
Where Gemini was right, and it matters
The Apple prompt asks for four quarters of income statement and balance sheet data. I checked the headline figures against Apple’s own press releases.
| Metric (FY26 Q3, June quarter) | Gemini | Apple newsroom | Verdict |
|---|---|---|---|
| Revenue | $109.4B | $109.4B | match |
| Diluted EPS | $2.02 | $2.02 (+29% YoY) | match |
| Gross margin | 50.1%, tariff refund noted | 50.1%, ~2pp tariff refund | match, context included |
| Net income | $29.8B | $29.8B | match |
The headline figures I checked in the other three quarters also matched. The Tesla share price was accurate too: Gemini quoted $328-330, close to the August 10 close of $330.88. Where the underlying data is recent, widely reported and heavily indexed, Gemini in this sample was highly accurate. If the viral post claimed only this, it would be right.
The five failure modes
1. The visible links did not prove the requested sources were used
The Apple prompt demands SEC 10-Q/10-K or Apple IR citations; the Tesla prompt asks for GuruFocus, Seeking Alpha or Finbox links. The responses named those documents in the text, but the visible source links attached to the responses included secondary or non-requested domains, and the chips did not establish which document produced each figure.
Google describes these chips as “sources and related content”: the links do not prove which document generated any particular number. The narrower audit finding is this: the response named the requested primary documents while the attached links pointed elsewhere. From the answer alone, the provenance of each figure was not traceable. That defeats the point of writing source requirements into the prompt.
2. An accurate share price came with an overstated market cap
The Tesla response quoted a share price of $328-330, close to the August 10 close of $330.88. But it also stated a market capitalization of $1.5 to $1.8 trillion.
Tesla reported 3,949,547,394 shares outstanding as of mid-July in its latest 10-Q. At $330.88 per share, that implies a market capitalization of about $1.307 trillion. The range in the response was therefore roughly 15 to 38 percent too high.
The response also produced a sum-of-the-parts estimate of roughly $1.06 trillion. But that is a valuation estimate, not a market-cap calculation, and an estimate is allowed to differ from the market price. The verifiable error is the stated market cap: the response got the quoted price right but paired it with an incompatible current-market-cap range.
3. The screen never defined its earnings basis
The dividend prompt sets three filters: ten-plus years of consecutive increases, yield above 3 percent, payout ratio below 60 percent. AbbVie appears in the results at “~54% (Non-GAAP).”
On GAAP earnings, AbbVie’s trailing payout ratio works out to roughly 195 percent. The arithmetic: $2.36 in FY2025 GAAP EPS, minus $1.24 for the first half of 2025, plus $2.42 for the first half of 2026, gives trailing-twelve-month GAAP EPS of about $3.54; the $6.92 annualized dividend divided by $3.54 is roughly 195 percent.
GAAP earnings run low partly because they include substantial intangible amortization, contingent-consideration remeasurement and other specified charges. The prompt never said which basis to use, so the answer used an unstated earnings basis and produced a pass that flips to a fail depending on the metric chosen. That is not a hallucination; it is a screen whose result hangs on a definition the prompt forgot to pin down. A parenthesis is doing a lot of load-bearing work.
4. The streak counts drift, and definitions matter
| Stock | Gemini’s streak | Company’s own wording | Gap |
|---|---|---|---|
| Target | 57 years | 55th consecutive year “on track” in 2026 | +2 |
| Best Buy | 22 years | 13 years of consecutive increases (FY2026 annual report) | +9 |
| Comcast | 19 years | 17 completed through 2025 | +2 |
| Chevron | 38 years | 38 completed; a 2026 raise positions it for a 39th | definition, not error |
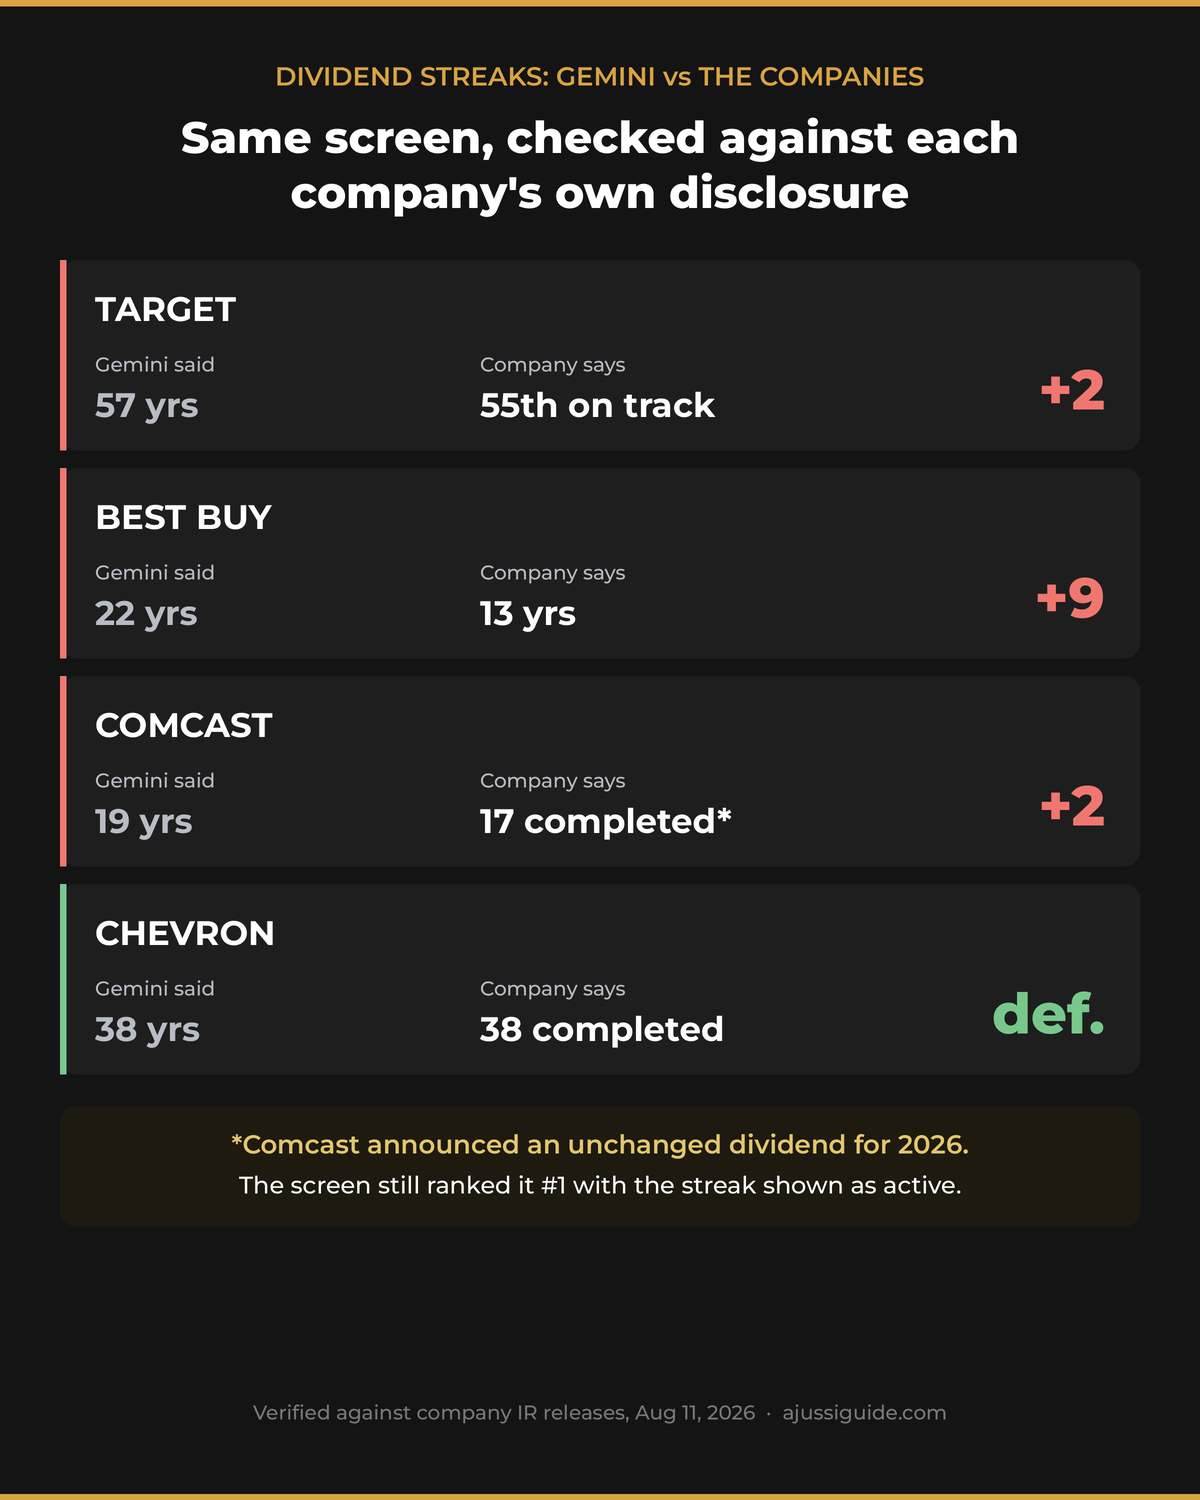
Chevron is the instructive row: 38 is defensible as a completed-years count, and my own first draft got it wrong in the other direction by treating the in-progress year as finished. Streak arithmetic has definition traps on both sides. But the three clear misses all run long, and Best Buy’s nine-year gap has no definitional excuse. It appears to conflate the years since the dividend began with the years it has actually been raised.
5. A stale streak status put Comcast at the top of the screen
Comcast led the screening table with a 19-year increase streak, a 5.2 percent yield, a 43 percent payout ratio and a “safe” verdict.
The company said its 2025 increase was its 17th consecutive annual increase. In January 2026, it announced that the annualized dividend would remain unchanged at $1.32 for 2026. If the prompt’s “ten-plus years of consecutive increases” means an active streak, Comcast no longer qualified when the screen ran in August.
A flat dividend does not by itself make the dividend unsafe. The verifiable failure is narrower: the response treated the growth streak as active and overstated it by two years, allowing a stale record to lead the screen months after the company disclosed no 2026 increase. This was the clearest screening-relevance risk in the test.
What this means if you use these prompts
- Recent-quarter results were the strongest part of this sample. Recalculate derived figures and re-check time-sensitive status fields. Market caps, ratios and streak counts are where this run broke.
- Re-run any screen’s filters yourself, on stated definitions. Of the five screened names, three streak counts ran long, one pass depended on an undefined earnings basis, and the top pick’s streak was no longer active.
- Treat source chips as leads, not proof. Open the primary document and match each figure to it. The chips do not establish which document produced which number.
- A “safe” dividend is not necessarily a growing dividend. Check payout safety and the active growth streak separately; this screen conflated them at the top of its own table.
Scope and date
Tested on 2026-08-11 in a signed-in Gemini web session; the account displayed Google One Pro, the model selector showed Flash, and no settings were changed. One fresh chat per prompt, prompts pasted verbatim from the original post. I ran and scored three of the eight Gemini stock analysis prompts in depth: Apple financials, Tesla valuation and the dividend screen, because they produce independently checkable numbers. The remaining five were outside this audit and are not covered by the conclusions above. Model behavior changes between versions and sessions; your run will differ.
I ran the same check-the-numbers routine on Claude vs ChatGPT with the same 10-K, where one model fabricated three figures, and my own AI stock analysis prompts write-up covers the prompt patterns I actually keep.
Frequently asked questions
Are Gemini stock analysis prompts safe to use?
For pulling a recent quarter’s reported numbers, accuracy in this test was excellent. For screening, derived ratios or streak records, every output needs independent verification: in this run, three of five screened names carried overstated streak counts and the top pick’s growth streak was no longer active.
Which figures or screening claims did Gemini get wrong?
In this test: Tesla’s market cap ($1.5-1.8T stated; the quoted share price and Tesla’s own share count imply about $1.31T), Target’s dividend streak (57 claimed; 2026 is on track to be the 55th), Best Buy’s streak (22 claimed, 13 in the company’s annual report), Comcast’s streak (19 claimed, 17 completed) and Comcast’s screening status (presented as an active streak although the company had announced an unchanged 2026 dividend).
Did Gemini follow the source instructions in the prompts?
Not verifiably. The prompts specified SEC filings, company IR pages and named data providers. The responses named those documents in the text, but the visible source links included secondary or non-requested domains, and the links do not establish which document produced which number.
Is Gemini better than ChatGPT for stock research?
The viral post claims so; this test did not compare them. In an earlier same-document test, Claude scored 8 of 8 on a 10-K while ChatGPT fabricated three figures. Cross-model claims need the same prompts run on both models on the same day.
What is the safest way to use AI for dividend screening?
Treat the output as a candidate list. For each name, check the company’s own IR page for three things: whether the streak is intact this year, which earnings basis the payout ratio uses, and the yield at today’s price. In this run, that check would have caught the Comcast and AbbVie issues.
Do these prompts require a paid Gemini plan?
This test cannot determine that. The session showed the Flash model, but the signed-in account also displayed Google One Pro. Model availability and behavior may differ by account, and nothing in the prompt text itself depends on plan tier.
This article is for informational purposes only. Nothing here is a recommendation to buy or sell any security mentioned, and investment decisions and their outcomes are your own responsibility.
Sources: Apple quarterly results: FY25 Q4, FY26 Q1, FY26 Q2, FY26 Q3 · Tesla Form 10-Q, Q2 2026 (share count) · Tesla historical price, August 10, 2026 · Target dividend release, June 2026 · Comcast: 2025 increase (17th consecutive), 2026 dividend maintained · Chevron 4Q 2025 earnings release · Best Buy FY2026 annual report · AbbVie: 2025 Form 10-K, Q2 2026 results, June 2026 dividend declaration · Google’s description of Gemini source chips. Last verified: 2026-08-11. Next review: November 2026.