What this checkedorders, revenue and margin are three different numbers across six names, and Super Micro’s gross margin moved 6.3% → 9.9% → 17.5% within one fiscal year (Aug 11 release).
What it did nothow the $60B+ order book converts into revenue and cash, and how customer concentration shifts, needs the next quarter’s filings.
Watch nextSMCI’s FY27 Q1 results in early November; figures for the other five companies are as of July 31.
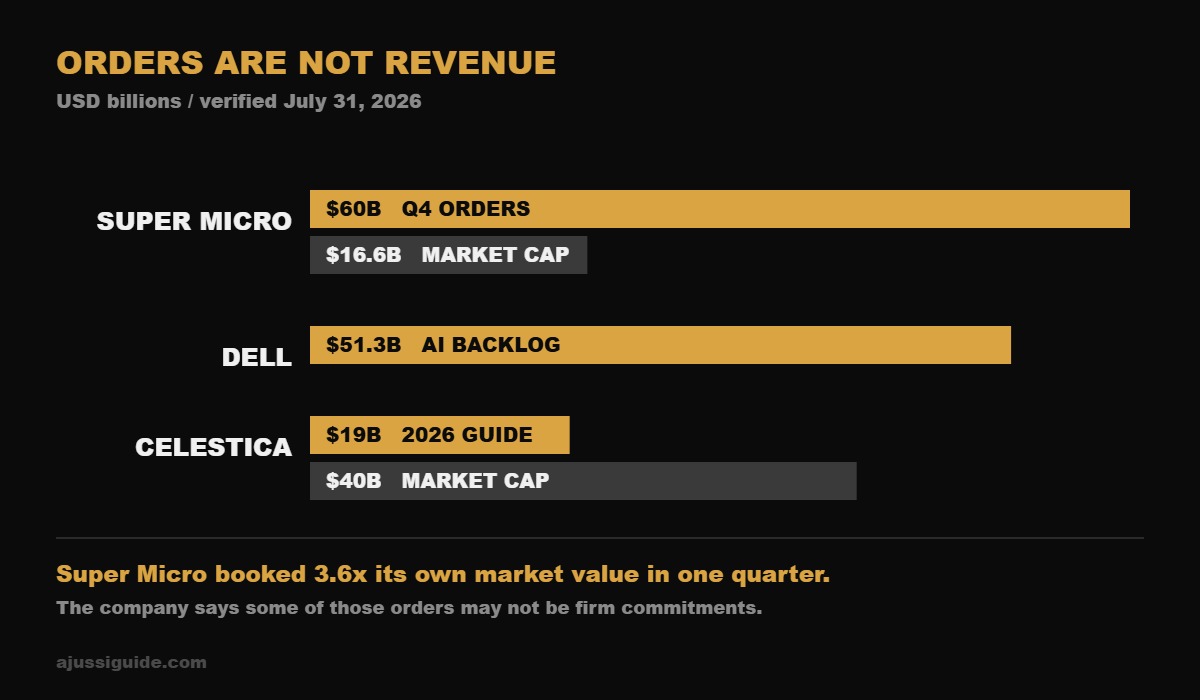
Here is the number that made me stop and re-read the filing. In its fourth-quarter preliminary update, Super Micro said it took in more than $60 billion of new orders in a single quarter. The company’s entire market capitalization on July 31, 2026 was about $16.6 billion — roughly 3.6 times smaller than one quarter of orders.
Two of the names on this list now have a dedicated head-to-head. The Super Micro vs Dell AI server stocks comparison digs into margins, customer concentration, and which risk profile fits which investor.
That is not a valuation ratio and should not be read as one. It is simply a way of showing the extraordinary scale of announced demand relative to the size of the company announcing it.
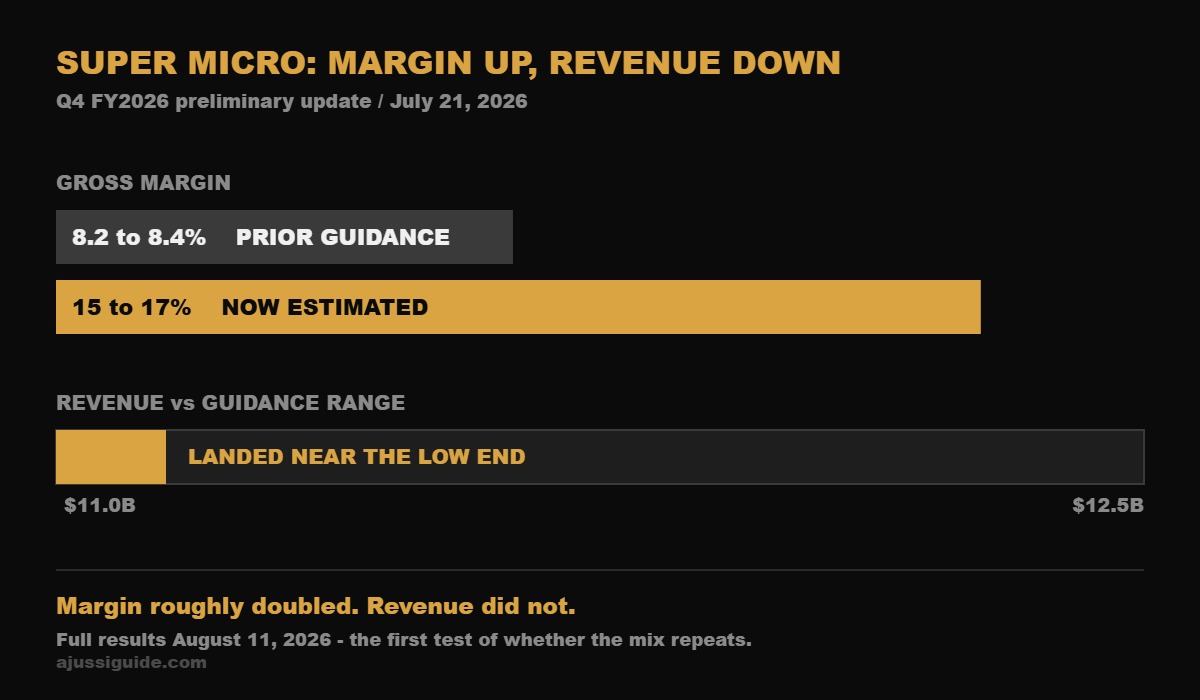
The second half of the release matters more. In the same update, Super Micro said revenue for the quarter would land near the low end of its $11.0–12.5 billion guidance. Orders exploded. Recognized revenue did not.
Work through the numbers for all six major AI server stocks and a pattern shows up that most headlines miss: the demand is real everywhere, but the speed and certainty with which it turns into margin is completely different from company to company.
What AI Server Stocks Actually Are — OEM vs ODM
When people say AI server stocks, they usually mean two different businesses wearing the same jacket.
An OEM sells servers under its own brand. Dell, HPE and Super Micro design a box, put their badge on it, and carry the customer relationship, the warranty and the service contract.
An ODM designs and builds to a customer’s specification, usually without its own badge on the finished rack. When a hyperscaler wants 12,000 custom racks, it does not walk into a showroom. It hands drawings to an ODM in Taiwan.
The distinction is not academic. It decides who holds inventory risk, who absorbs component cost swings, and — the part investors keep discovering the hard way — who actually keeps a percentage at the end.
Orders, Revenue and Cash Are Three Different Things
Super Micro’s July 21 preliminary business update is the cleanest case study in this sector.
- New orders in Q4 FY2026: more than $60 billion
- Gross margin estimate: 15–17%, against prior guidance of 8.2–8.4%
- Revenue: near the low end of $11.0–12.5 billion guidance
- Full results: August 11, 2026: revenue about $11.1 billion, GAAP gross margin 17.5% (preliminary, unaudited)
Before treating an order book as future profit, it helps to separate three things that get collapsed together. Orders indicate potential demand. Revenue is recognized only after the company satisfies the relevant delivery or performance obligations. Cash collection is a separate step again — revenue can sit in receivables for a long time.
This is also the distinction AI research tools get wrong most often. When I gave the same 10-K to Claude and ChatGPT, both separated the three concepts correctly and one of them still reported an operating cash flow figure that does not appear in the filing.
The company itself flagged the first gap. Some of those orders may not constitute firm commitments and may be subject to cancellation or delays. That sentence is in the release. In a sector where hyperscalers revise capital plans every quarter, that caveat is doing real work.
WHERE THE MARGIN GOES
🧠 Silicon — the GPU vendor sets the price before anyone else gets a vote · the largest single line in the bill of materials
🏭 Assembly — turning parts into racks at scale · high revenue, thin percentage
💧 Thermal and power — liquid cooling and power distribution inside the rack · where design still earns a premium
🌐 Interconnect — switches and optics tying racks together · the segment ODMs are climbing into
Revenue is decided at the top of this stack. Margin is decided at the bottom.
Super Micro: Volatile, But Recovering
The lazy version of the story told about AI server stocks is “revenue booms, profit lags”. Super Micro’s own filings say something more specific and more useful.
Gross margin was 6.3% in fiscal Q2 2026 (quarter ended December 31, 2025), recovered to 9.9% in fiscal Q3 (quarter ended March 31, 2026), and Q4 came in at 17.5% (July preliminary estimate 15–17%; August 11 release). Non-GAAP EPS in Q3 came in at $0.84 against a $0.62 forecast.
That is not a company failing to convert demand. It is a company whose margin swings by hundreds of basis points from quarter to quarter depending on customer and product mix. For an investor, volatility of that size is a different risk from weakness — and that is why the durability of the margin reported on August 11 matters more than the order headline.
Dell and HPE Are Not Telling the Same Story
Dell reported AI-optimized server revenue of $16.13 billion in its first quarter of fiscal 2027 — up 757% — with an AI server backlog of $51.3 billion. Management guided full-year revenue to $165–169 billion, of which roughly $60 billion is projected full-year FY2027 AI server revenue. Note that this is a different kind of number from Super Micro’s $60 billion, which was a single quarter of new orders. Same figure, opposite meaning.
HPE is the case that breaks the simple narrative. In fiscal Q2 2026 it posted record revenue of $10.7 billion, up 40%, with non-GAAP EPS of $0.79 against its own guidance of $0.51–0.55. Its Cloud & AI segment reached $7.7 billion, and the company raised full-year fiscal 2026 EPS guidance by more than 40%, to $3.35–3.45.
In other words: profitability is not uniformly lagging across AI server stocks. At HPE it moved ahead of the company’s own expectations. Any thesis that treats these six names as one trade is already wrong.
The Comparison That Actually Matters
Here are six AI server stocks arranged not by preference but by where they sit in the value chain — because that position, more than any price target, shapes what happens to their margins.
| Company | Listing | Role | Verified 2026 datapoint | Type of figure |
|---|---|---|---|---|
| Super Micro | Nasdaq: SMCI | OEM, AI-first | >$60B Q4 new orders (Jul 21); GM 6.3% → 9.9% → 17.5% (Aug 11 release) | Orders + margin trend |
| Dell | NYSE: DELL | OEM, enterprise scale | AI server rev $16.13B, +757%; backlog $51.3B | Recognized revenue + backlog |
| HPE | NYSE: HPE | OEM, enterprise + networking | Q2 rev $10.7B, +40%; FY26 EPS guide raised 40%+ | Reported results |
| Celestica | NYSE: CLS | ODM/EMS, hyperscaler-facing | Mkt cap ≈$40B; 2026 rev guidance $19B | Guidance |
| Hon Hai (Foxconn) | Taiwan-listed | ODM, largest by volume | ≈43% of GB-series racks in 2025; Q1 rev ≈$66.6B | Share + revenue |
| Quanta | Taiwan-listed | ODM, cloud-focused | Q1 2026 rev ≈$25.3B, +66.6% | Revenue |
The most interesting line is Celestica. It is an ODM — supposedly the low-margin end — and its market capitalization of roughly $40 billion is about 2.4 times Super Micro’s. Its Connectivity and Cloud Solutions segment (AI-optimized servers, switches, storage for hyperscalers) is about two-thirds of revenue, and it raised 2026 guidance to $19 billion.
The market is not paying for the badge on the box. It is paying for the position in the chain.
The Taiwan Access Problem
Two of the six most important names in AI server stocks are difficult for a US retail investor to own directly.
Hon Hai (Foxconn) shipped roughly 12,000 Nvidia GB-series racks in 2025 for about 43% share, with orders concentrated among Google, AWS and Microsoft, and Q1 2026 revenue of about $66.6 billion, up 30%. Quanta posted Q1 2026 revenue of roughly $25.3 billion, up 66.6%, with its QCT subsidiary building for hyperscale deployments.
These are two of the largest AI server stocks in the world by volume, and both are primarily Taiwan-listed. Various over-the-counter instruments referencing Taiwanese manufacturers exist, but names and tickers are easy to confuse — Hon Hai and Foxconn Technology are separate listed entities — and OTC lines vary in liquidity and sponsorship. Verify the exact security with your broker before assuming you are buying what you think you are buying. I am deliberately not printing a ticker here that I cannot confirm.
The practical consequence: for most US investors, accessible exposure to the ODM layer runs through Celestica rather than through Taipei.
Four Risks That Could Weaken the Thesis
Orders are not contracts. Super Micro said so itself. Backlog can be revised, delayed or canceled, and hyperscaler capital plans are reset every quarter.
Margin is structurally capped at the assembly layer. The GPU vendor prices the most expensive component. Everything downstream competes on execution rather than pricing power — Super Micro’s quarterly margin changes illustrate that variability. Customer and product mix is one factor; less favorable mix or costs could reduce margins in a later quarter.
These stocks have already run. Dell is up roughly 242% year to date and Celestica around 117% over a year. A correct thesis bought at the wrong price still loses money, and this group moves violently in both directions.
Customer concentration. The IEA reports that capital spending by five major technology companies exceeded $400 billion in 2025 and could rise a further 75% in 2026 — larger than global investment in oil and natural gas production. That is an enormous pool of demand, but it is controlled by a very small group of buyers.
A company-specific overhang at Super Micro. In the same release, the company disclosed that its board is conducting an independent review of certain transactions in connection with alleged export-control issues, and stated plainly that the outcome “could affect our forecasts, these preliminary results and prior period results.” That is the company’s own language, in the document announcing the $60 billion order figure. On August 20, 2026 the company announced that the investigation led by its independent directors was complete, saying it found no evidence that current senior management knew of the alleged diversion scheme. In the same announcement, the company said it continued to cooperate with ongoing government investigations, and the FY2026 Form 10-K filed on August 31 pairs an unqualified opinion on the financial statements with an adverse opinion on internal control over financial reporting. Completion of the company’s own review does not close the regulatory risk.
How I Read This Group
I do not think the useful question is which of these AI server stocks is “best”. Every one of them has genuine demand behind it. The useful question is narrower:
When the order book converts to recognized revenue, who keeps a percentage of it — and how reliably?
Three things are worth tracking each quarter: gross margin direction, backlog conversion into recognized revenue, and customer concentration. In its preliminary, unaudited August 11 release, the company reported Q4 GAAP gross margin of 17.5%, after a year in which the same figure was 6.3% and then 9.9%. The next questions are whether that margin holds in subsequent quarters, how orders convert into revenue and cash, and how customer concentration changes.
For the layers underneath this one, I have written about the power infrastructure that feeds these racks, the transformer bottleneck holding up new sites, and the memory that goes inside the servers. Spending plans across the big buyers are tracked in the AI Capex Tracker.
Every figure in this piece was checked with the verification prompts described in AI Stock Analysis Prompts: 5 I Actually Use, and Where Each One Broke, including the one that caught an earnings number I had wrong.
Frequently Asked Questions
What are the best AI server stocks to buy?
There is no single answer, and anyone ranking AI server stocks for you without showing margin data is guessing. The six names covered here — Super Micro, Dell, HPE, Celestica, Hon Hai and Quanta — cover the OEM and ODM layers between them. Which suits you depends on whether you want brand-level exposure with service revenue attached, or chain-position exposure with volume attached. Compare gross-margin trends and backlog conversion before relying on any price target.
What is the difference between an OEM and an ODM in AI servers?
An OEM sells servers under its own brand and owns the customer relationship, warranty and service contract. An ODM designs and builds to a customer’s specification, typically without its badge on the rack. OEMs generally carry higher revenue per unit and more service attach; ODMs carry more volume at thinner percentages. The line has blurred as ODMs move into networking and integration.
Can US investors buy Taiwan-listed AI server makers?
Not straightforwardly. Access typically requires an international brokerage account or an over-the-counter instrument, and OTC lines differ in liquidity and sponsorship. Company names are also easy to confuse. Confirm the exact security with your broker first. For most US investors, NYSE-listed Celestica is the practical route into the ODM layer.
Why did Super Micro’s gross margin estimate jump so much?
The company attributed the move from 8.2–8.4% guidance to an estimated 15–17% to a favorable customer and product mix in the quarter. Context helps: gross margin was 6.3% in fiscal Q2 and 9.9% in fiscal Q3 of the same year. Q4 gross margin reported on August 11, 2026 was 17.5%, above the estimated range. Whether that mix repeats in later quarters is the open question.
Six server names are still one part of the stack. Owning several AI stocks does not always mean you are diversified. They may all depend on the same infrastructure layer. The AI infrastructure exposure checker shows which of the eight layers a portfolio actually owns.
Original data verified: July 31, 2026. SMCI results, investigation and audit status updated: September 15, 2026. Market values and other companies’ figures retain their original reference dates. Figures are point-in-time snapshots, not live quotes. This article is information, not investment advice — do your own research and consider your own circumstances before buying anything.