Memory prices and earnings moved sharply in 2026, while the public numbers across the group remain difficult to compare. Search for memory stocks and you get a list. What you rarely get is an explanation of what each company on that list actually reports.
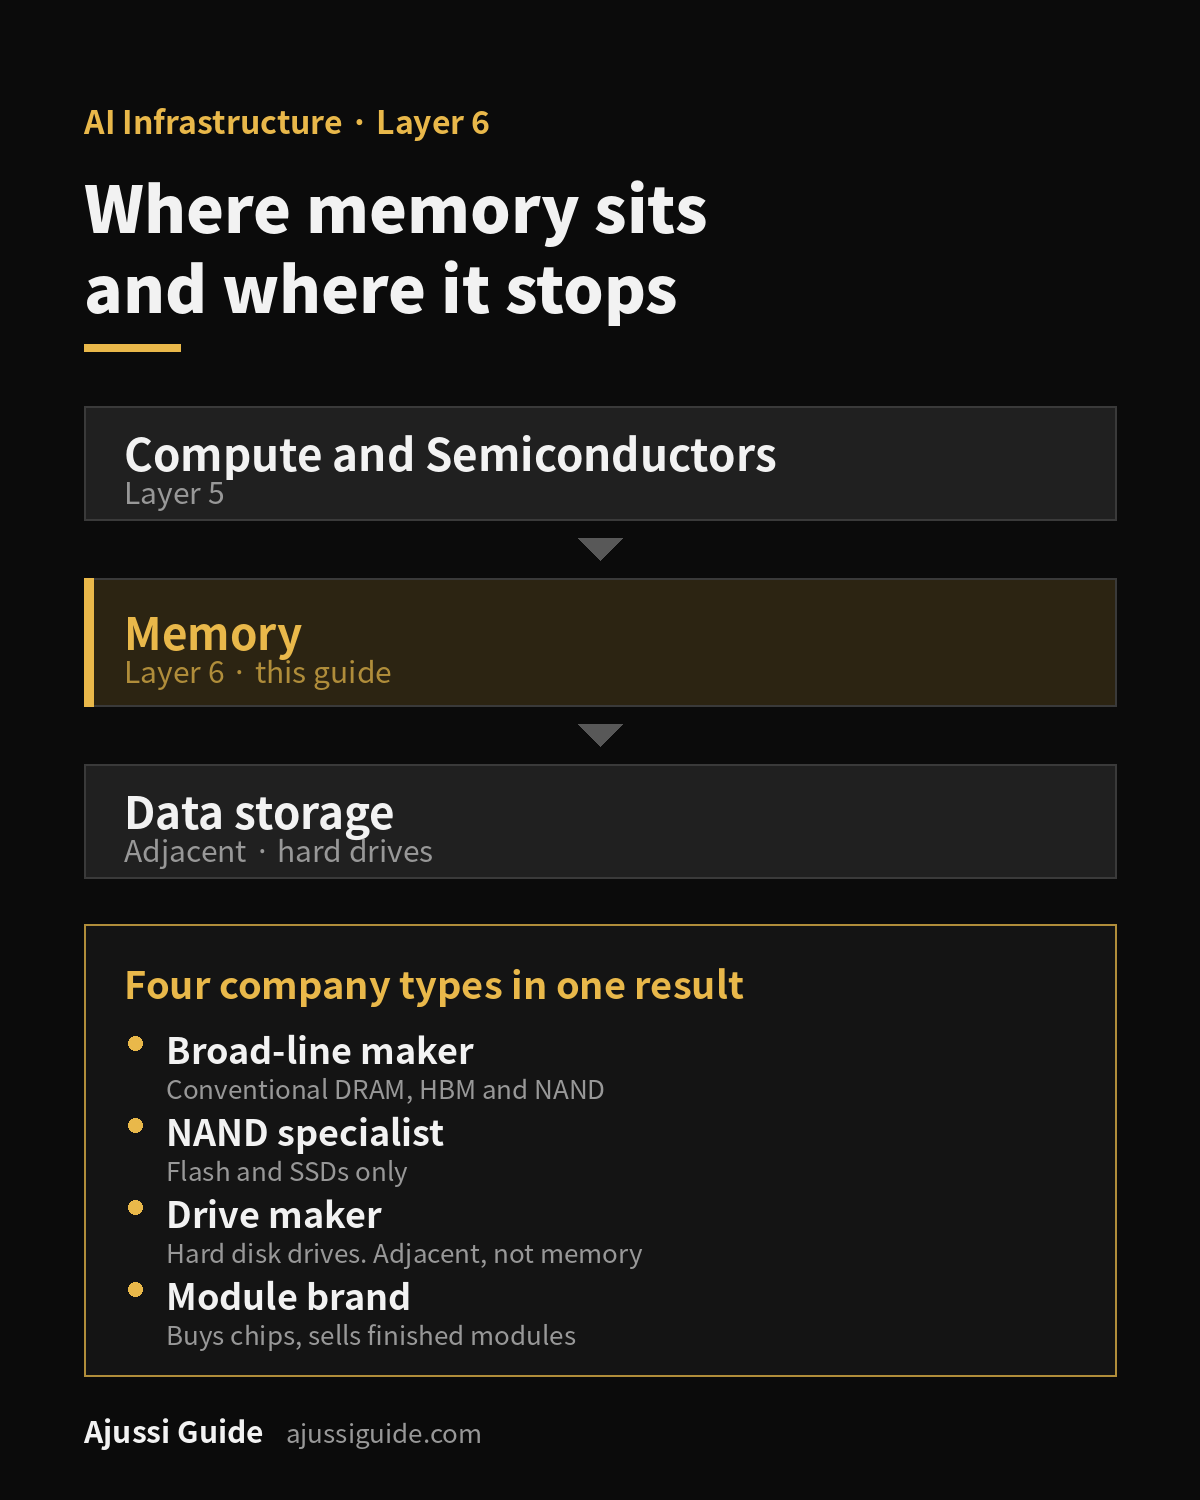
This guide defines memory stocks as companies with direct exposure to semiconductor memory such as DRAM, NAND and HBM. Hard-drive makers are covered separately as adjacent data-storage companies.
One technical point first, because the title of this guide depends on it. HBM is a stacked form of DRAM, not a separate memory family. Micron describes it plainly on its own HBM4 product page: HBM stacks DRAM dies on top of each other and connects them with through-silicon vias. This guide separates conventional DRAM, NAND flash and HBM because their end markets, product economics and disclosure patterns differ, not because they are three unrelated technologies.
Everything below comes from filings and earnings materials read directly, each linked at first use. Where a figure is calculated rather than disclosed, it is marked.
What actually counts as a memory stock
In the U.S. Google results checked on August 20, 2026, the category is defined as companies that make “computer memory chips and data storage parts.” That single sentence bundles two different businesses, and the consequence shows up in the same search. Ask for the top memory stocks and Seagate appears, described in the answer itself as a maker of hard disk drives.
The broad definition is not wrong. It is just unusable for comparing companies, because the businesses inside it run on different physics and report on different terms.
| Layer | What the company sells | Examples |
|---|---|---|
| Broad-line memory maker | Conventional DRAM, HBM and NAND | Micron, SK hynix, Samsung |
| NAND specialist | NAND flash and SSDs | SanDisk, Kioxia |
| Data-storage maker | Hard disk drives | Western Digital, Seagate |
| Module and brand | Finished modules built from purchased chips | Corsair, Kingston, G.Skill |
| Investment vehicle | A basket, not a manufacturer | Roundhill Memory ETF |
The same answer puts the module distinction in a parenthetical: consumer brands design and sell finished RAM modules but do not fabricate the chips. That parenthetical is the whole point. A module brand and a fab operator can have opposite revenue and cost exposure to the same memory price move, because for one the chip is revenue and for the other it is cost.
The storage boundary needs a note of its own. Western Digital separated its flash business into SanDisk in 2025, with the distribution effective 21 February 2025 and Nasdaq trading in SNDK beginning 24 February. The Google answer checked here still describes Western Digital as a maker of “data storage and flash memory solutions,” which was accurate before the separation and is not accurate now. Screener pages on page one describe the company correctly, but still list it beside SanDisk under the same heading without saying that one now sells drives and the other sells flash.
Why memory stocks and memory-company rankings differ
The original search results page surfaced two different list questions. The directly expanded answer box and a separate standalone-query AI Overview produced different company sets, because they used different scopes.
| Question | Sorting axis | Companies named |
|---|---|---|
| Top three memory companies | Manufacturing scale in DRAM and HBM | Samsung, SK hynix, Micron |
| Top memory stocks | US trading access, recent price performance, and a broad storage definition | Micron, SanDisk, Western Digital, Seagate |
Nothing about that is contradictory once you see the axes. The first question ranks factories. The second ranks tickers a US brokerage account can reach.
Access is one plausible reason for the gap.
| Company | How a US investor reaches it |
|---|---|
| Micron | Nasdaq common stock, ticker MU |
| SanDisk | Nasdaq common stock, ticker SNDK |
| SK hynix | Nasdaq ADS, ticker SKHY, one ADS equal to one tenth of a common share |
| Samsung Electronics | KRX listing; US resident individuals are restricted from trading its GDRs under Rule 144A |
| Kioxia | Tokyo Stock Exchange Prime, code 285A |
Samsung’s restriction applies to US resident individuals. Non-US investors may have access through eligible GDR brokers, and foreign investors can also reach KRX-listed shares subject to their broker and market-access arrangements. Access differences are one plausible reason a company can lead manufacturing scale and still be missing from a US-oriented list, not proof that it is untradeable.
One widely repeated claim should be handled carefully here. The three largest DRAM makers are often said to control more than ninety percent of DRAM and flash supply combined. The claim is often associated with DRAM concentration, but it should not be treated as an exact current statistic, and it fails once NAND is included.
On the DRAM side, TrendForce’s first-quarter 2026 DRAM survey put Samsung at 38.5 percent, SK hynix at 28.8 percent and Micron at 22.4 percent of a 97 billion dollar quarter, which is 89.7 percent between them [calculated]. Taiwanese suppliers including Nanya, Winbond and PSMC account for part of the remaining market.
On the NAND side the picture is entirely different. TrendForce’s second-quarter 2026 NAND survey put Samsung at 29.3 percent and Kioxia at 13.6 percent, with the top five brands combining for 68.87 billion dollars. Working from the two published shares implies a total market near 78.7 billion dollars [calculated], which puts Samsung, SK hynix and Micron together above 62.5 percent [calculated] and leaves Kioxia and SanDisk with roughly a quarter of the market between them. The top five themselves account for about 87.5 percent [calculated], so even the group of five is not the whole market.
What each memory maker actually discloses
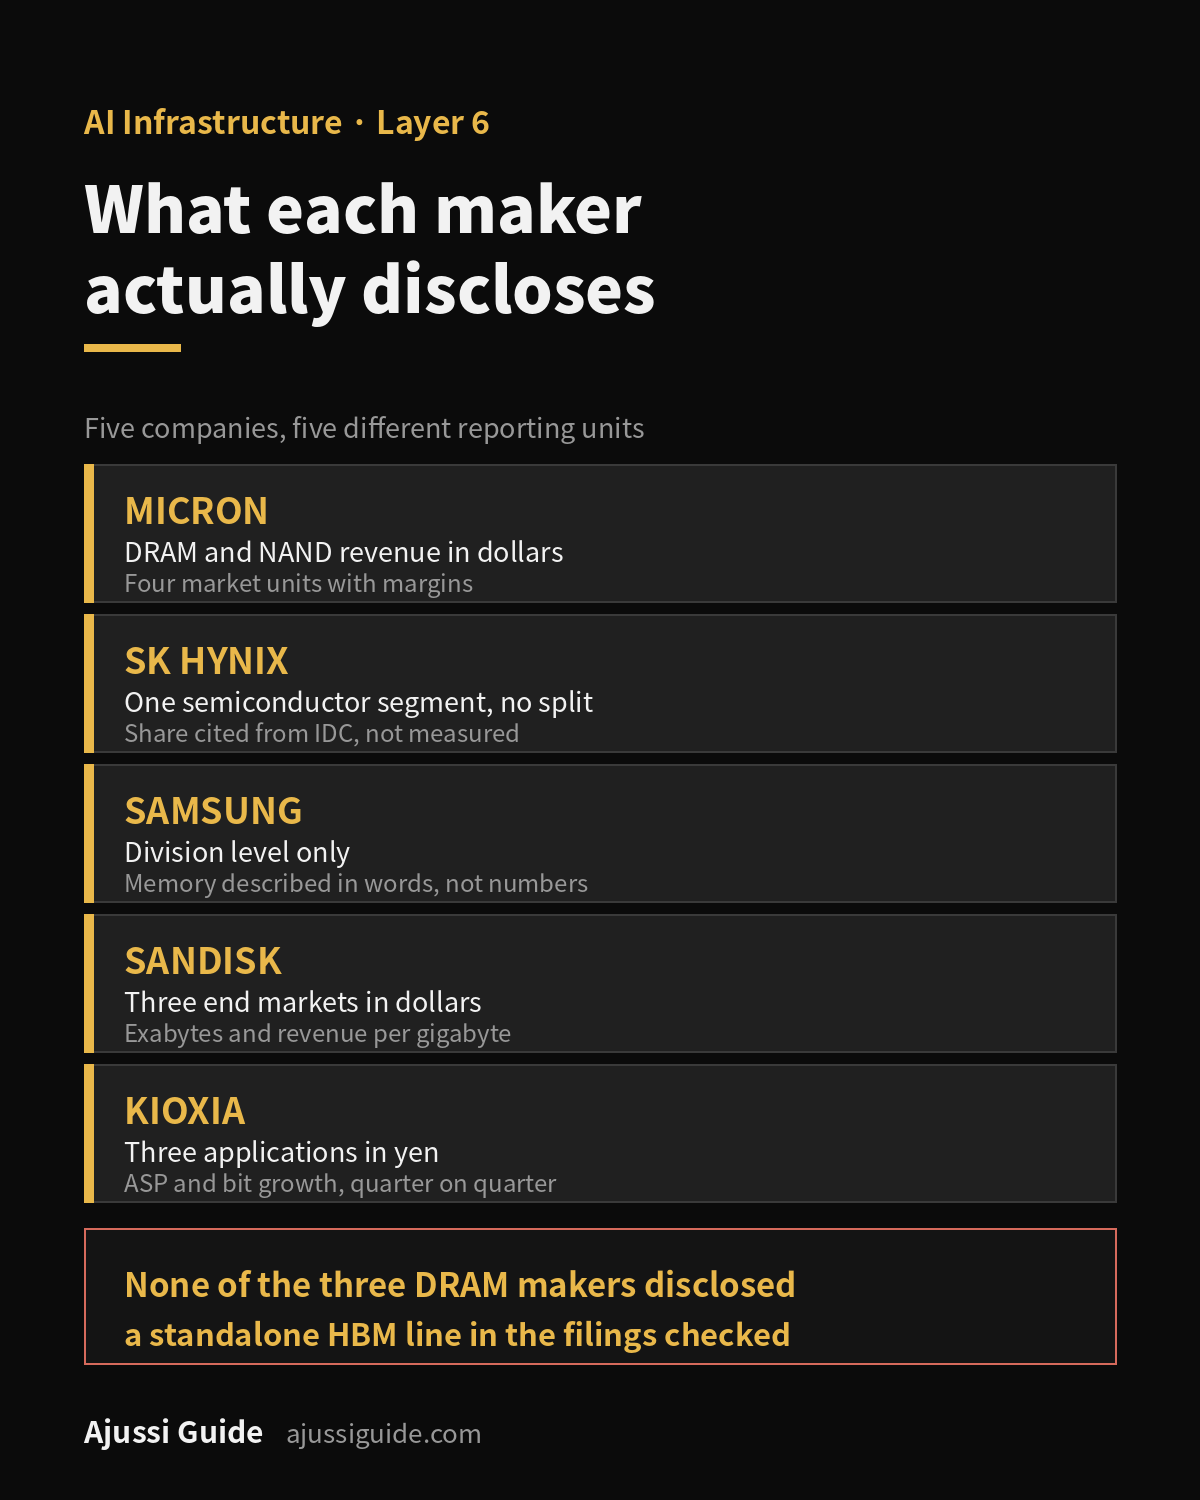
This is the part no list answers, and it is the reason a side-by-side table of “memory margins” is usually meaningless.
| Company | Product split | End market | Volume and price |
|---|---|---|---|
| Micron | DRAM and NAND, in dollars | Four units, with margins | Ranges only |
| SK hynix | None | One segment only | Not in filing |
| Samsung | None | Division level only | None |
| SanDisk | NAND only | Three markets, in dollars | Growth rates |
| Kioxia | NAND only | Three uses, in yen | Growth rates |
None of the three broad-line makers disclosed a standalone HBM revenue line in the documents checked here. SanDisk and Kioxia make NAND, so the question does not apply to them.
Micron reports on two axes
Micron’s fiscal third quarter of 2026 ended 28 May 2026 with revenue of 41,456 million dollars and a GAAP gross margin of 84.6 percent. The 10-Q splits that revenue two ways.
By technology, in Note 14: DRAM 31,328 million dollars, NAND 9,943 million, and other products, primarily NOR, 185 million.
By market segment, in the earnings release: Cloud Memory 13,769 million dollars at a 78 percent operating margin, Core Data Center 11,524 million at 83 percent, Mobile and Client 11,521 million at 86 percent, and Automotive and Embedded 4,634 million at 75 percent.
HBM appears in neither split as its own line. The 10-Q places it inside the Cloud Memory unit, which is defined as covering hyperscale cloud customers “and HBM for all data center customers.” Average selling prices and bit shipments are disclosed as ranges rather than numbers. Compared with fiscal Q2 2026, DRAM average selling prices increased in a low-60% range while bit shipments increased in a low-single-digit percentage range.
SK hynix reports as one segment
SK hynix’s semi-annual report filed with the SEC on 18 August 2026 shows second-quarter revenue of 79.3 trillion won and operating profit of 60.5 trillion won, which works out to a 76.3 percent operating margin [calculated].
That margin is the consolidated company figure, not an HBM margin, and it should never be relabeled as one. The company presents its business as a single semiconductor segment on the stated basis that semiconductor revenue exceeds ninety percent of the total. DRAM and NAND appear only as named “major products” of that one segment, with no revenue split. Market share is disclosed, but as a citation to IDC rather than a company measurement.
Samsung stops at the division line
Samsung reported consolidated second-quarter revenue of 171.5 trillion won and operating profit of 89.5 trillion won, with the Device Solutions division at 127.5 trillion won in revenue.
The memory business is described as setting an all-time high for quarterly revenue and operating profit, as reaching a record share of server revenue in its sales mix, and as having scaled up HBM4 sales. None of those three statements comes with a number. Device Solutions contains memory, System LSI and foundry together, so its 127.5 trillion won is not a memory figure, and the consolidated 171.5 trillion won is even further from one.
SanDisk and Kioxia report volume and price
Both NAND specialists provide operating detail, but at different scopes.
SanDisk’s fiscal 2026 10-K covers a year ended 3 July 2026 with revenue of 20,248 million dollars, split by end market into Datacenter 5,153 million, Edge 12,160 million and Consumer 2,935 million. Volume and pricing come as growth rates: datacenter products sold rose almost 120 percent on an exabyte basis while revenue per gigabyte rose almost 150 percent.
Kioxia’s quarter ended 30 June 2026 brought revenue of 1,767.1 billion yen, split by application into SSD and Storage 1,174.7 billion, Smart Devices 525.7 billion and Others 66.7 billion. Its presentation states quarter-on-quarter ASP up around 70 percent on a US dollar basis and bit growth up a low single-digit percentage.
Two cautions on those two. SanDisk’s fiscal 2025 and 2024 comparatives were prepared using allocations and carve-out methodologies from Western Digital’s records, so they are not a standalone company’s history. And Kioxia’s “Others” line includes revenue from sales to the SanDisk group through their joint venture, so adding the two companies’ revenue together can double-count.
The NAND side of this question — which of the makers, controller vendors and storage-system companies actually reports a data-center SSD number — is worked through company by company in Enterprise SSD Stocks: 12 Companies by Supply-Chain Role.
Conventional DRAM, NAND and HBM do not move the same way
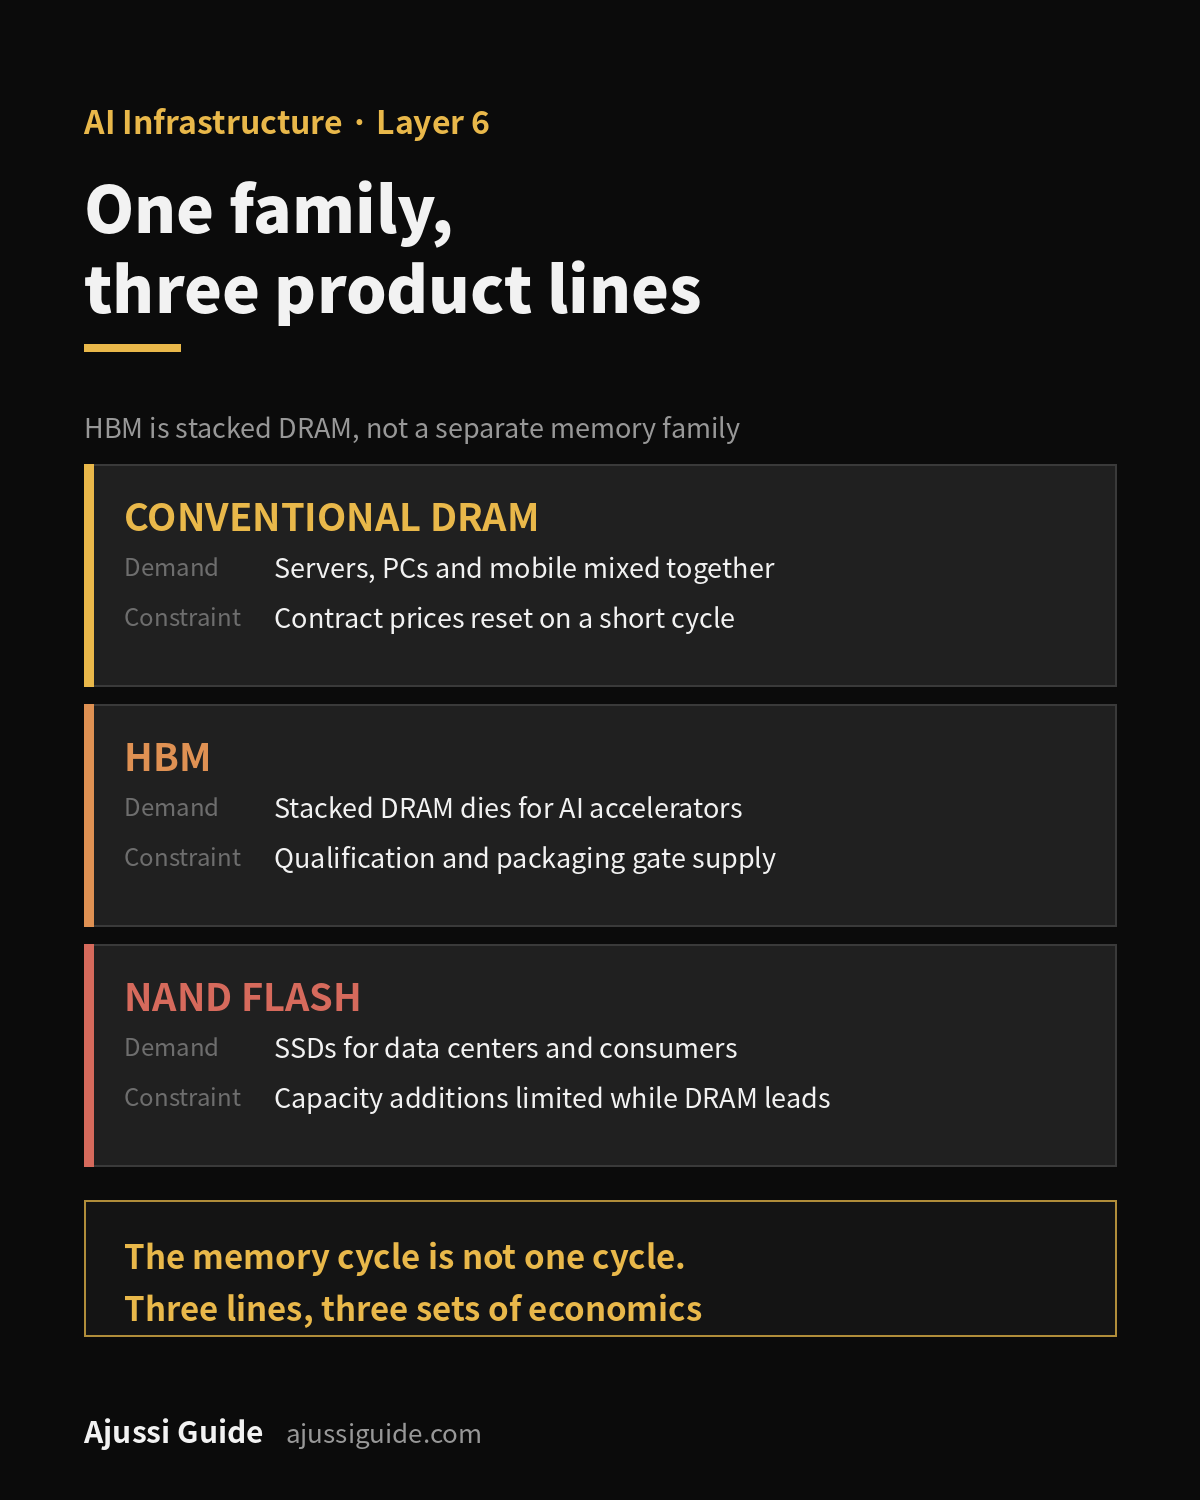
HBM is part of the DRAM family, but its AI-accelerator demand, qualification process and packaging constraints can produce different economics from conventional DRAM. Treating “the memory cycle” as one thing hides that.
Micron’s own filings show the contract structure changing underneath the cycle. The company describes recently executed strategic customer agreements as take-or-pay arrangements with binding commitments for specific volumes over multi-year terms, with pricing for most agreements either fixed or bounded by minimum and maximum levels. As of 28 May 2026 the transaction price allocated to remaining performance obligations was approximately five billion dollars, against a balance that was “not material” nine months earlier.
Read that number carefully. Micron states directly that the remaining performance obligation figure is based on minimum committed volumes and minimum pricing and “is not expected to be indicative of future revenue under these contracts.” Agreements without fixed pricing are excluded from it entirely, and contracts with terms of a year or less are excluded as a practical expedient. It is a partial lower-bound measure, not total contract value or revenue guidance.
The supply side is moving unevenly too. TrendForce reported that suppliers are prioritizing capital spending on DRAM and HBM, which limits new NAND capacity. That is an industry-research observation rather than a company disclosure, and it belongs in a different column from the filings above.
Why memory margin is not comparable across these companies
Three of the differences above compound into one trap for anyone lining up memory stocks side by side.
The first is scope. Micron reports margins for four market-based units. SK hynix reports one consolidated margin covering everything. Samsung reports a division margin covering memory, System LSI and foundry together. Putting those three percentages in one column compares a product-market margin, a company margin and a multi-business margin as though they measured the same thing.
The second is the reporting calendar. Micron’s quarter ended 28 May 2026. SK hynix, Samsung and Kioxia closed on 30 June. SanDisk, Western Digital and Seagate closed on 3 July. That is a gap of 33 to 36 days [calculated], roughly five weeks, in a period when contract prices moved sharply inside a single quarter.
The third is currency. Micron, SanDisk, Western Digital and Seagate report in dollars, SK hynix and Samsung in won, Kioxia in yen. Converting them for a ranking table requires choosing a rate and a date. Kioxia prints the USD/JPY rate used in its presentation, but that does not create a common conversion basis across the companies.
There is one comparison worth making, and it is about scale rather than margin. Micron reported 41.5 billion dollars in a single quarter. Western Digital reported 12.9 billion dollars for its entire fiscal 2026. These are different period lengths, so this is an illustration of scale rather than a ranking, but it is enough to show why a single list treating both as memory stocks flattens something important.
From an expansion announcement to actual bit shipments

Capital spending announcements, line conversions, wafer starts and bit shipments are four different events, and quarters can pass between them. AI-related commentary clusters at the announcement end, where future production output has not yet been observed.
This is the same grammar applied in the transmission and distribution layer, where orders, backlog, remaining performance obligations and revenue had to be separated before any of them meant anything, and in the semiconductor layer, where fab expansion announcements were separated from production.
The same separation runs through the networking layer, where remaining performance obligations range from about $164.6 billion at one company to about $31.9 million at another, and four of the eight publish no total at all.
Two of this quarter’s data points sit at opposite ends of that sequence. Samsung shipping the industry’s first HBM4E samples is an announcement-stage event. Micron’s 31,328 million dollars of DRAM revenue is a booked one.
What to check next quarter
The checklist for memory stocks has to be per company, because the disclosures are not symmetric.
| Company | The line that moves first |
|---|---|
| Micron | DRAM and NAND revenue in Note 14, plus segment operating margins |
| SK hynix | Consolidated operating margin, and whether any product split appears |
| Samsung | Whether a standalone memory figure ever accompanies the record language |
| SanDisk | Datacenter revenue and exabytes sold |
| Kioxia | SSD and Storage revenue, ASP and bit growth |
| Western Digital, Seagate | Revenue and gross margin, remembering these are drive makers |
One trap deserves a line of its own. Western Digital’s fourth-quarter GAAP diluted earnings per share of 8.21 dollars includes a 2,050 million dollar gain on its retained interest in SanDisk, and the fiscal-year total of that gain was 6,498 million dollars. The company itself excludes it as not indicative of underlying performance, and non-GAAP EPS for the quarter was 3.56 dollars. Reading the GAAP figure as operating performance would be a mistake.
Memory price indices generally require third-party data and should be kept separate from the primary-source table above.
If you want the HBM supply chain specifically rather than the full memory layer, that is covered in the HBM memory stocks guide. For where memory sits relative to design, foundry and equipment, see the semiconductor stocks map, and for the rack the memory ends up in, the server stocks guide.
Frequently asked questions
What actually counts as a memory stock, and what does not?
Memory stocks, as this guide uses the term, are companies with direct exposure to semiconductor memory: conventional DRAM, HBM and NAND. Hard-drive makers such as Western Digital and Seagate are adjacent data-storage companies. Module brands that buy chips and assemble finished products are a different business again, and an ETF is a basket rather than a manufacturer.
Why do memory-company rankings and memory-stock lists name different companies?
Because they sort on different axes. Rankings of memory companies sort by manufacturing scale in DRAM and HBM. Lists of memory stocks sort by what a US brokerage account can buy, by recent price performance, and often by a definition broad enough to include drive makers.
Do the big memory makers all report the same way?
No. Micron discloses DRAM and NAND revenue in absolute dollars and market-segment revenue with margins. SK hynix presents a single semiconductor segment with no product split. Samsung stops at the division line and describes its memory business in words rather than numbers. None of the three disclosed a standalone HBM revenue figure in the documents checked here.
Do conventional DRAM, NAND and HBM move together?
Not exactly. HBM is part of the DRAM family, but AI-accelerator demand, qualification cycles and packaging constraints can give it different economics from conventional DRAM, and NAND runs on its own mix of consumer and enterprise SSD demand.
Can you compare memory margins across these companies?
Not directly. The margins cover different scopes, the quarters end up to five weeks apart, and the three currencies require a common conversion rate and date that the company filings do not provide on a consistent basis.
How do you separate an expansion announcement from actual output?
By tracking the sequence. Capital spending announcement, line conversion, wafer starts and bit shipments are separate events, and quarters can pass between them, with AI commentary concentrated at the announcement end.
Is the claim that three companies control over ninety percent of memory supply correct?
It is often associated with DRAM concentration, but it should not be treated as an exact current statistic, and it fails once NAND is included. On TrendForce’s first-quarter 2026 DRAM survey the top three came to 89.7 percent [calculated], while on its second-quarter 2026 NAND survey the same three were above 62.5 percent [calculated], with Kioxia and SanDisk holding roughly a quarter between them.
This guide is for information only and is not investment advice. Figures come from company filings, earnings releases and investor materials read directly on the dates noted, and from market-research surveys identified as such. Companies restate and reclassify, so verify against the current filing before acting.
Last verified: 20 August 2026
For fund-level exposure rather than individual names, the HBM ETF comparison shows what DRAM, HBMX and Korea’s 442580 actually hold.