A generator that nobody can connect to is not power. It is an asset waiting on a queue.
Searching for transmission and distribution stocks returns lists of industrial tickers. The question underneath is narrower: once the electricity exists, what has to be built before a data center can actually draw it, and who gets paid for building that.
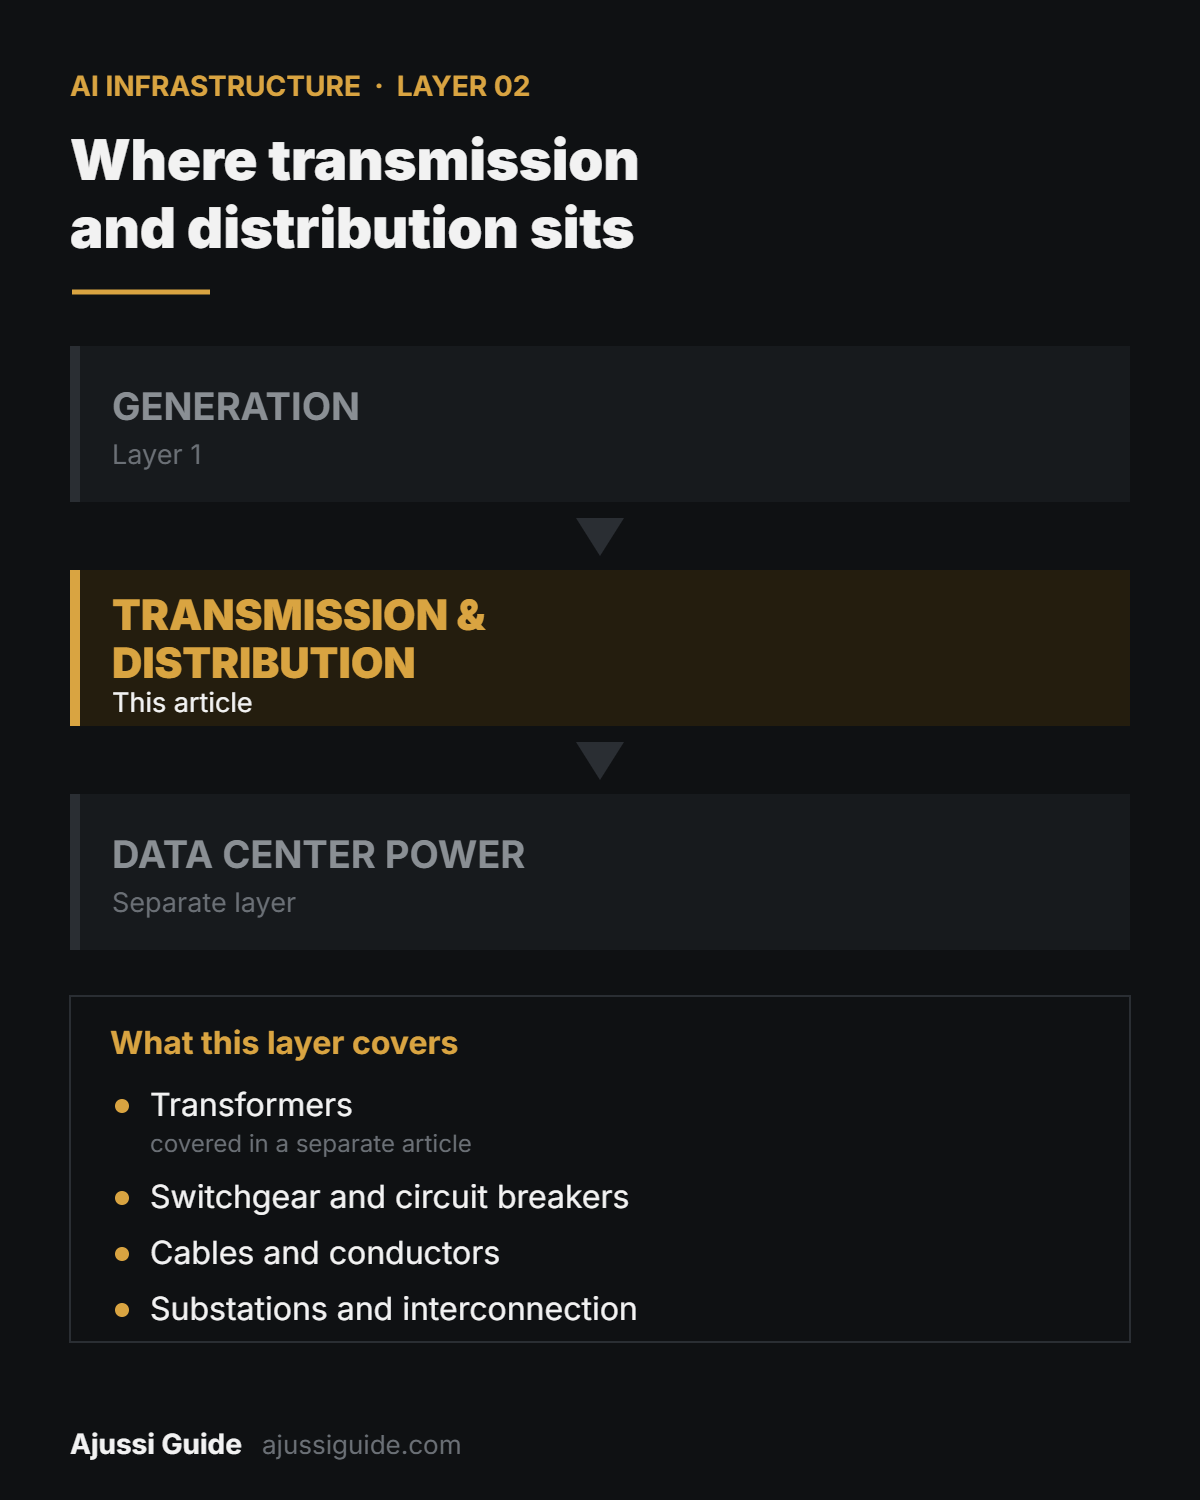
This article maps the transmission and distribution stocks that own that step. It covers the layer between the plant and the building. Generation is a separate question, handled in its own map.
Electricity that cannot be delivered is not supply. The delivery path is a separate industry with its own order books, its own timelines, and its own way of counting demand.
What you need to know before the company names
Four ideas explain most of what looks confusing about transmission and distribution stocks.
The queue is a separate constraint from equipment supply
Equipment shortages are real. So is the connection process, and solving one does not solve the other. Most transmission and distribution stocks are exposed to both.
Lawrence Berkeley National Laboratory tracks every generator and storage project asking to connect to the US transmission grid. Two patterns hold across that dataset. Projects spend years between requesting a connection and operating, and most capacity that enters the queue is eventually withdrawn rather than built. The current figures are in the snapshot section below.
A manufacturer can add a production line. It cannot shorten an interconnection study, and it cannot approve a utility construction schedule.
One caution that is widely mishandled. This dataset does not include data center interconnection. LBNL states it directly: there are separate queues for large loads, and those are not in this report. The queue totals describe generation and storage asking to supply the grid. They are not a measure of data center demand, and coverage that presents them that way is misreading the source.
Backlog is not a standard metric in this layer
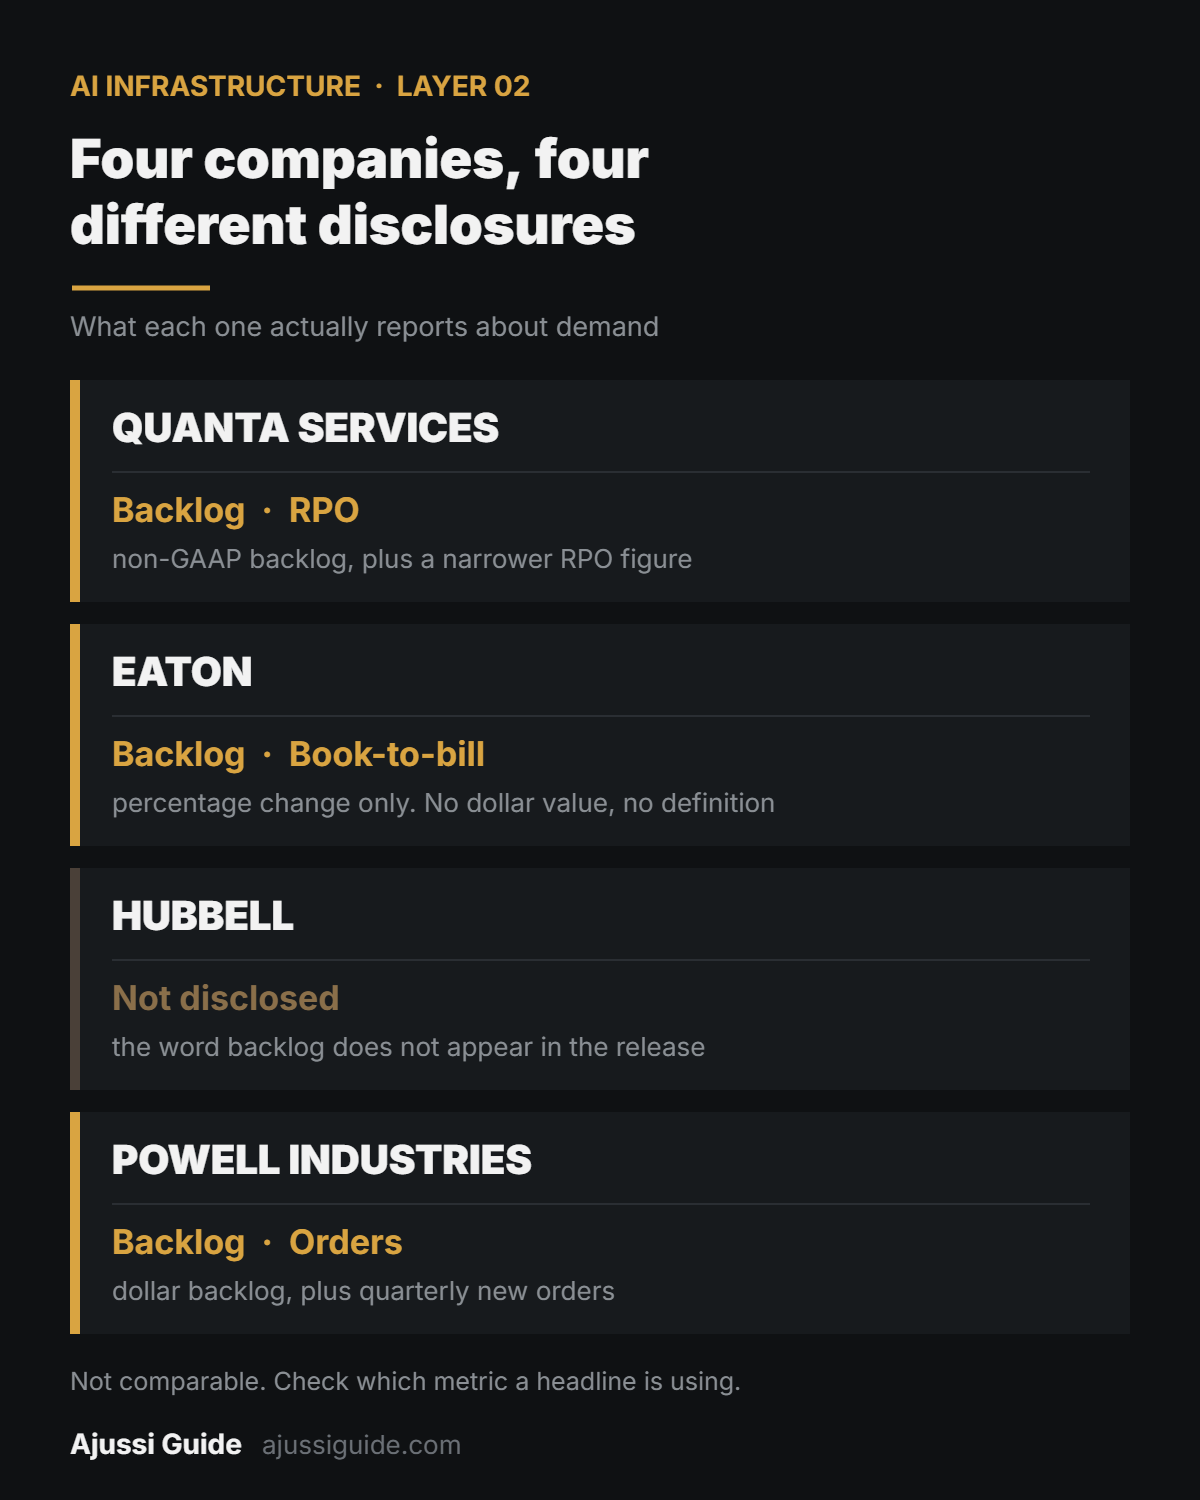
This is the single most useful thing to understand about transmission and distribution stocks. Companies in this layer report demand in different ways, and the numbers are not comparable.
| Company | What it actually discloses |
|---|---|
| Quanta Services | A dollar backlog figure, explicitly non-GAAP. Also a separate, smaller remaining performance obligation figure |
| Eaton | Backlog as a percentage change only.NOT DISCLOSED: dollar value, and any definition of the term |
| Hubbell | NOT DISCLOSED: the word backlog does not appear in its quarterly release |
| Powell Industries | A dollar backlog figure, plus new orders for the quarter |
| nVent (Adjacent) | NOT DISCLOSED in the release. A forward-looking expectation appears in the slide deck CROSS-LAYER |
A headline saying one of these companies posted record demand tells you little until you know which of those things was measured.
Backlog is the headline number in this layer, and it is the one least standardized across the companies that report it.
Orders, bookings, backlog, and revenue are four different events
The gap between them is where most of the confusion in this sector lives.
| Term | What it means, and when cash arrives |
|---|---|
| Order or booking | A customer commits. Cash: not yet. Can be cancelled or modified |
| Backlog | Work committed but not delivered. Definition varies by company. Cash: over the contract life |
| Remaining performance obligation | Contracted performance obligations not yet recognized as revenue. Its scope follows accounting rules and company disclosures, and is generally narrower than management-defined backlog. Cash: over the contract life |
| Revenue | Delivered and recognized. Cash: this period |
Quanta shows why this is not academic. Its reported backlog exceeds its remaining performance obligations by a wide margin, and the difference is the company’s own estimate of orders under master service agreements and certain non-fixed price contracts. That estimate includes assumed renewals. Quanta also states that its methodology may not be comparable to other companies.
Equipment makers, contractors, and service providers run on different clocks
Transmission and distribution stocks do not share a single revenue clock. An equipment maker sells a physical product and recognizes revenue as performance obligations are satisfied. A contractor sells labor and project execution, and its backlog can stretch across multi-year master agreements. Neither controls the regulatory approval that decides when work starts.
What transmission and distribution stocks actually build
Transformers
The most quoted bottleneck in the entire grid buildout. Large power transformers are custom, capital-intensive, and the lead times have stretched to multiple years.
This is deep enough to deserve its own treatment, and it has one. See our separate breakdown of transformer stocks and the AI data center connection, which covers the specific manufacturers and the lead time data.
Switchgear and circuit breakers
The equipment that routes and protects power at high voltage, and the part of the layer where several transmission and distribution stocks compete directly. Powell Industries and Eaton both sit here, alongside Schneider Electric, whose stock I compared head-to-head with Eaton, and Quanta entered manufacturing through a joint venture with Hyosung HICO producing gas circuit breakers rated up to 800 kV at a site in Canonsburg, Pennsylvania.
Cables and conductors
Transmission lines and underground cable. Much of the largest capacity here sits with companies listed outside the US, which narrows the set of transmission and distribution stocks available to US investors, which is a real limitation on the US-listed opportunity set in this part of the layer.
Substations and interconnection work
Where equipment becomes an operating connection, and where several transmission and distribution stocks actually earn their revenue. This is contractor territory rather than equipment territory, and it is the part of the chain most exposed to permitting and utility scheduling.
How transmission and distribution stocks actually make money
Searches for power grid equipment stocks often group manufacturers and contractors together, even though their revenue cycles are fundamentally different. Three business models sit inside the same headline, and they respond to the same news differently.
Equipment makers sell hardware. Revenue is recognized as contractual performance obligations are satisfied. A large order signed today may not appear in reported revenue for years. At Powell, quarterly new orders have recently exceeded quarterly revenue by a wide margin. That tells you demand is strong. It does not tell you when the money arrives.
Contractors and service providers sell execution. Their revenue tracks construction activity, which tracks permitting and utility capital plans. Margins in this model move with project mix and execution rather than with product pricing.
Diversified electrical companies sell into this layer alongside several others. Eaton’s Americas electrical business carries a materially higher operating margin than its contractor peers, but grid work is only one part of that number and the company does not break out how much.
So the schedule and the mix, not the sector label, separate these companies from one another.
An order book tells you what a customer intends. A construction schedule tells you when anyone gets paid.
Current Snapshot, August 2026
이 절만 분기마다 갱신한다. 본문·기업 표·FAQ에는 분기 수치를 반복하지 않는다.
Data as of 2026-08-17.
The interconnection queue
| Metric | Value |
|---|---|
| Capacity actively seeking interconnection, end of 2025 | 2,061 GW REPORTED |
| Of which generation | 1,312 GW REPORTED |
| Of which storage | 749 GW REPORTED |
| Capacity with a draft or executed interconnection agreement, not yet operating | 549 GW REPORTED |
| Median request to operation, 2025 completions | 61 months REPORTED |
| Capacity from 2000 to 2020 requests that reached operation | 13 percent REPORTED |
| Capacity that withdrew after executing an interconnection agreement, 2000 to 2022 | 41 percent REPORTED |
Source: Lawrence Berkeley National Laboratory, published June 2026, data through end of 2025.
Scope limit. These figures cover generation and storage projects seeking to supply the grid. Large load interconnection, which is where data centers sit, is tracked in separate queues and is not included. The 2025 median also draws on a sample in which two major regions contributed no completed projects, so it is not a clean national figure.
What each company disclosed
| Company and metric | Value and label |
|---|---|
| Quanta Services, total backlog | $53.4 billion BACKLOG REPORTED NON-GAAP |
| Quanta Services, remaining performance obligations | $33.6 billion RPO REPORTED |
| Quanta Services, difference between the two | About $19.9 billion BACKLOG CALCULATED.Estimated master service agreement orders including assumed renewals |
| Quanta Services, Electric segment operating margin | 11.5 percent, against 10.1 percent a year earlier MARGIN REPORTED |
| Eaton, Electrical sector backlog | Up 43 percent year over year BACKLOG REPORTED.Percentage only. Dollar value and definition NOT DISCLOSED |
| Eaton, Electrical book-to-bill | 1.2 on a rolling twelve-month basis ORDERS REPORTED |
| Eaton, Electrical Americas net sales | $4.0 billion, up 18 percent organically REVENUE REPORTED |
| Eaton, Electrical Americas operating margin | 27.5 percent MARGIN REPORTED |
| Hubbell, Utility Solutions net sales | $1,026 million, up 10 percent REVENUE REPORTED.Grid Infrastructure up about 12 percent, Grid Automation up about 1 percent |
| Hubbell, backlog | NOT DISCLOSED |
| Powell Industries, backlog | $2.4 billion, up 69 percent from a year earlier BACKLOG REPORTED |
| Powell Industries, new orders | $934 million in the quarter ORDERS REPORTED |
| Powell Industries, quarterly revenue | $312 million REVENUE REPORTED |
| Powell Industries, fiscal Q3 data center award | Exceeding $400 million ORDERS REPORTED CROSS-LAYER.Bookings, not revenue. Tied to a behind-the-meter design of on-site generation assets, which is generation-side scope. Additional data center awards were disclosed in earlier fiscal quarters, also as lower bounds. Relative size cannot be determined, and no company-reported cumulative total exists |
| nVent, Systems Protection net sales | $1,072 million, up 70 percent REVENUE REPORTED CROSS-LAYER |
| nVent, data center sales | Over $2 billion expected for 2026 GUIDANCE FORWARD-LOOKING CROSS-LAYER.From the earnings presentation. Not evidence of transmission and distribution demand |
The transmission and distribution stocks company map
Most transmission and distribution stocks lists rank companies. This one maps them by what they sell and what they disclose, because disclosure quality determines whether the story can be verified at all. It is not a ranking and not a list of recommendations. Current figures are in the snapshot above.
| Company | Role, business, and evidence |
|---|---|
| Quanta Services (PWR) | Contractor and services. Electric power and underground infrastructure construction. Discloses: dollar backlog NON-GAAP and a separate remaining performance obligation figure.AI link: data centers appear only in acquisition and joint venture descriptions. Evidence: no dollar amount attributed to data centers. The words AI and hyperscaler do not appear in the quarterly release |
| Eaton (ETN) | Diversified electrical equipment. Power distribution, switchgear, modular enclosures. Discloses: backlog percentage change and book-to-bill. Dollar backlog and definition NOT DISCLOSED.AI link: management calls data centers a key growth driver. Evidence: no data center revenue or backlog breakout |
| Hubbell (HUBB) | Utility equipment. Grid Infrastructure and Grid Automation product lines. Discloses: segment revenue and product line growth rates. Backlog NOT DISCLOSED.AI link: management names data center investment as one of three megatrends behind organic growth. Evidence: no data center breakout, and no backlog disclosure of any kind |
| Powell Industries (POWL) | Switchgear and electrical systems for utility, industrial, and commercial sites. Discloses: dollar backlog and quarterly new orders, including data center awards. AI link: discloses lower-bound values for data center bookings. One fiscal Q3 award exceeding $400 million was tied to behind-the-meter on-site generation. Evidence: orders, not revenue. That award is CROSS-LAYER and does not evidence transmission and distribution demand on its own |
Adjacent company
nVent Electric (NVT) appears in most lists alongside the four above, but its data center exposure runs through enclosures, liquid cooling, and equipment inside the facility. That is the data center power and cooling layer rather than the transmission and distribution layer. Its forward-looking data center sales figure is CROSS-LAYER and should not be read as evidence of grid demand.
Evidence levels are not equal across this table. One company discloses lower-bound values for data center orders, one gives a forward-looking figure in a presentation, and the rest disclose nothing specific. Listing them side by side does not make their exposure comparable.
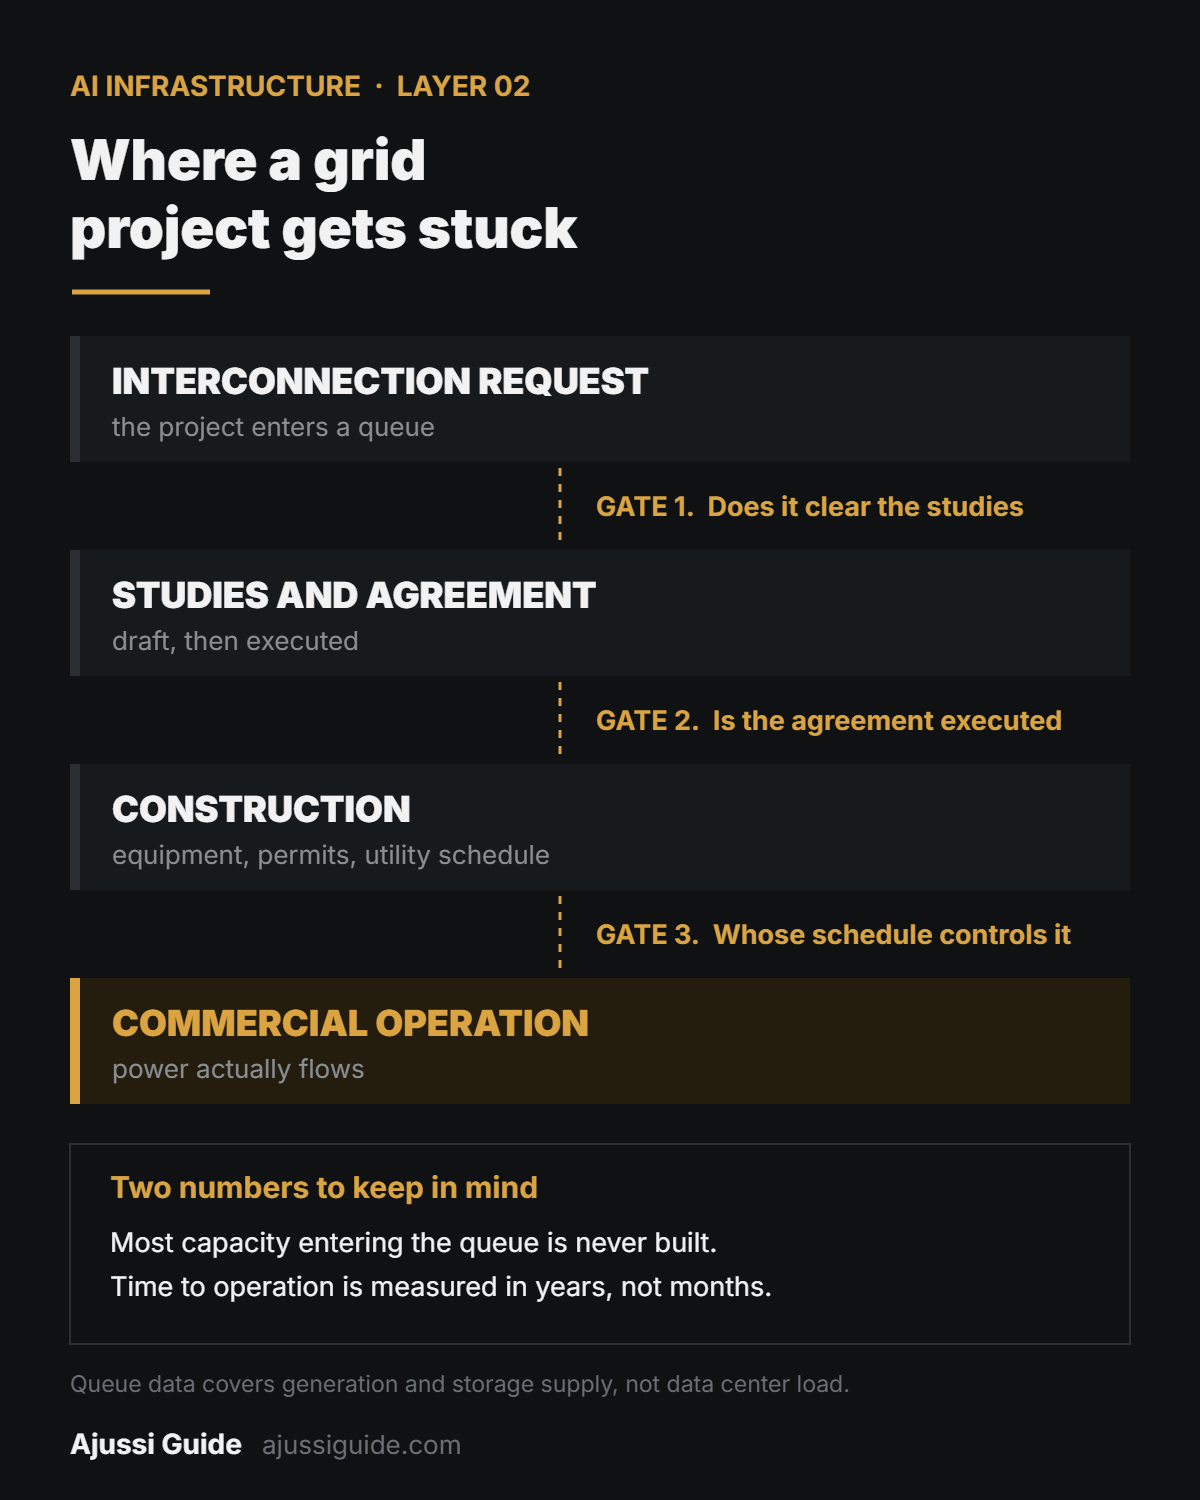
What actually goes wrong
Most of the gap between what transmission and distribution stocks announce and what they deliver comes from a few recurring places.
The queue does not clear on demand. Time from interconnection request to commercial operation is measured in years. Ordering equipment faster does not shorten a study process.
Most requests are withdrawn. A large majority of the capacity entering queues never operates, and a substantial share withdraws even after executing an interconnection agreement.
Backlog definitions differ enough to break comparisons. One company’s backlog includes assumed contract renewals. Another reports no backlog at all. Ranking by backlog growth compares different things.
Orders are not revenue. A book-to-bill ratio well above one describes demand, not this year’s earnings.
Attribution is mostly absent. Most companies here disclose no dollar amount tied to data centers. The market describes them as AI infrastructure names, and their own quarterly releases largely do not.
Some data center wins are not grid wins. One disclosed fiscal Q3 data center award exceeding $400 million is tied to behind-the-meter on-site generation. That is generation-side scope appearing in a switchgear company’s order book, and it does not evidence transmission and distribution demand.
Acquisitions inflate growth. Several companies here bought a meaningful share of their reported growth. Comparing one company’s reported growth to another’s organic growth produces a misleading ranking.
Interest cost follows the deals. Acquisition debt shows up below the operating line in later quarters, and at least one company in this group saw net interest expense rise sharply after two large purchases.
Concentration risk runs both ways. Quanta explicitly frames its strategy as avoiding concentration in any single end market. That is a defense against a data center slowdown and also a limit on data center upside.
Regional data is uneven. National medians for queue duration hide regional extremes, and the most recent cohort excludes some major regions entirely.
What to watch, and where to find it
Tracking transmission and distribution stocks is mostly a matter of watching a small number of disclosures.
Which demand metric is being quoted. Backlog, remaining performance obligations, orders, and revenue are four different things. Check which one a headline uses.
Whether a company defines its own terms. A backlog percentage with no dollar value and no stated methodology is weaker evidence than a dollar figure with a definition.
Capacity holding a draft or executed interconnection agreement but not yet operating. This is a later-stage pipeline than the total queue, although it includes both draft and executed agreements and does not guarantee that the projects will reach operation. It measures generation and storage supply, not data center load.
Book-to-bill. Above one means the order book is growing faster than deliveries. It says nothing about margin.
Acquisition contribution. Separate organic growth from bought growth before comparing companies.
Any company that starts breaking out data center exposure. Almost none do. The first ones to disclose it will make the whole layer easier to analyze.
The short version
Generation decides whether the electricity exists. Transmission and distribution stocks decide whether it can get anywhere. The constraint here is not only a factory. It is also a queue, a permit, and a utility construction schedule, and those move on their own clock.
That is why demand numbers in this sector look better than revenue numbers. Several disclosed demand indicators are strengthening, but they are not interchangeable. Revenue still follows construction, and construction follows approvals that no equipment maker controls.
So the useful question to ask about transmission and distribution stocks is not which company is exposed to AI. It is which demand metric a company actually discloses, whether that metric is defined, and how much of the growth was bought rather than earned.
In this layer, the definition of the number matters as much as the number. Two companies reporting record demand may not be reporting the same thing.
One more thing worth tracking in this layer: the permitting side itself has become an investment variable. New York’s statewide freeze on hyperscale projects and the bills spreading through state legislatures are covered in my data center moratorium guide – the interconnection queue decides when equipment gets ordered, but moratoriums decide whether the queue even moves.
Related reading
More on transmission and distribution stocks and the layers next to them.
- Transformer Stocks: 5 AI Data Center Plays for 2026 goes deep on the single most quoted bottleneck in the grid buildout.
- Power Grid Stocks: Who Generates the Power AI Data Centers Need covers the generation layer upstream of everything here.
- Utility Stocks and Data Center Electricity Demand looks at the regulated utilities that own much of this infrastructure.
- AI Power Infrastructure Stocks: 5 Best Picks for 2026 Investors is a broader survey across the equipment side.
FAQ
What are transmission and distribution stocks
Transmission and distribution stocks are the listed companies that build, supply, or service the path electricity takes from a power plant to a customer. That includes transformers, switchgear, cables, substations, and the contractors who install and connect them.
They are distinct from generation companies, which produce the electricity, and from regulated utilities, which often own the network and earn a return on the capital they invest in it.
Why do grid projects take so long
Equipment can take years to procure, but it is not the only long step, and it is not the step transmission and distribution stocks control. Connecting a new project to the transmission system requires interconnection studies, agreements, and construction scheduling involving the grid operator and the utility.
Median duration from request to operation has risen substantially over the past two decades. The current figure is in the snapshot section above.
Does the interconnection queue measure data center demand
No, and this is a common error. The Lawrence Berkeley National Laboratory queue data covers generation and storage projects asking to supply the grid. Large load interconnection, which is where data centers sit, is tracked in separate queues that are not included.
This limit applies to every queue figure in this article, including the capacity holding a draft or executed interconnection agreement. That number is a supply-side pipeline. It does not measure data center electricity demand or large load connection volume.
A headline presenting queue totals as evidence of data center demand is misreading the source.
What is the difference between backlog and remaining performance obligations
Remaining performance obligations are contracted performance obligations not yet recognized as revenue. Their scope follows accounting rules and company disclosures, and is generally narrower than management-defined backlog. Backlog is a broader, non-GAAP measure that can include estimated orders under master service agreements, and in at least one case includes assumed contract renewals.
Backlog is usually the larger number and the softer one. Companies define it differently, and one company’s methodology may not be comparable to another’s.
Do these companies disclose how much revenue comes from data centers
Mostly not. Among the transmission and distribution stocks covered here, one discloses lower-bound values for data center orders, one gives a forward-looking data center sales expectation in a presentation, and the rest disclose no data center figure at all.
Even the disclosed order figures need care. One disclosed fiscal Q3 award exceeding $400 million is tied to behind-the-meter on-site generation, which is generation-side scope rather than grid delivery. All disclosed values are lower bounds, so their relative size cannot be compared.
This is the main reason it is hard to compare AI exposure across this layer using published numbers.
Is a high book-to-bill ratio always good
For transmission and distribution stocks it means orders are arriving faster than deliveries, which is a genuine demand signal. It says nothing about profitability.
A high book-to-bill ratio says nothing about the margin, timing, or execution risk attached to those orders. Read it alongside margin guidance.
Why did revenue grow so much faster than organic revenue at some companies
Acquisitions. Several transmission and distribution stocks have been buying capability, and reported growth includes those purchases.
Comparing reported growth at one company to organic growth at another produces a misleading ranking. The acquisition debt also shows up later as interest expense.
When will we know whether the grid buildout is real
Capacity holding a draft or executed interconnection agreement but not yet operating is a later-stage indicator than total queue capacity. It includes both draft and executed agreements and does not guarantee that those projects reach operation, and it still measures generation and storage, not data center load.
Beyond that, watch backlog at transmission and distribution stocks converting into reported revenue, and watch for the first companies to break out data center exposure explicitly. Right now the market is inferring an exposure that the filings do not confirm.
Sources and update log
본문 수치는 각 기업의 공식 발표와 공시, 그리고 로렌스버클리국립연구소 보고서를 기준으로 했다. 마지막 확인은 2026-08-17이고, 현황 스냅샷 절만 분기마다 갱신한다.