Last checked 2026-10-02 · Data latest quarterly earnings releases, 8-K exhibits, call prepared remarks and investor materials for 12 companies (quarters ended June–September 2026); TrendForce 2Q26 and Counterpoint 2Q26 estimates shown separately · Next update after the October–December earnings season · Get update alerts ↗
What this checked — Which of 12 enterprise SSD stocks report a data-center or SSD figure in their own materials: Sandisk’s Datacenter end-market line ($2,977M), Micron’s approximate call disclosure (nearly $10B), Kioxia’s SSD & Storage category (¥1,174.7B), Silicon Motion and Phison product-line mix, Everpure and NetApp system revenue, Western Digital and Seagate guidance.
What it did not — Rank the companies by amount (fiscal periods and currencies differ), verify research-firm estimates against unpublished company data, read the earnings presentations of Western Digital and Seagate for exabyte figures, or confirm the Samsung 60% server-SSD figure beyond a press report.
Watch next — Whether Micron repeats a data-center SSD figure in FQ1 2027, whether Samsung or SK hynix put a number on enterprise SSD, Phison’s monthly revenue mix, and Everpure’s hyperscaler revenue as design wins convert.
AI data-center spending moved from GPUs to HBM, and in 2026 it reached the next line item: enterprise SSDs. TrendForce puts second-quarter 2026 enterprise SSD revenue for the top five vendors at $37.59 billion, up 103.6% from the prior quarter, and Counterpoint says enterprise SSDs took 48% of all NAND bits shipped in the same quarter, up from 26% a year earlier. A search for enterprise SSD stocks returns ticker lists that mix a NAND fab, a controller designer, a storage-array vendor and a hard-drive maker as if they were the same trade. They are not. This post sorts 12 listed companies into four supply-chain roles and records what each one actually disclosed about data-center SSD in its most recent quarterly results, so the reader can see where the revenue is booked, where it is described, and where it is only implied.
What enterprise SSD stocks have in common, and where they split
Enterprise SSDs are NAND flash drives built for data-center workloads, with interface, capacity and endurance options that vary by use case: PCIe Gen5 and Gen6 drives for AI servers, SATA drives for infrastructure roles, and endurance grades matched to read-heavy or write-heavy jobs. High-capacity examples include Kioxia’s LC9 at up to 245.76 TB in the E3.L form factor. Every company in this post touches that product, but at different points in the chain, and the point determines how the revenue shows up in company filings and earnings materials.
The split matters because the three numbers investors watch move in different places. Volume shows up at the NAND maker as bits shipped. Price shows up at the NAND maker as average selling price, and at the controller or module vendor through its own product mix. Demand from hyperscalers shows up at the storage-system vendor as design wins and product revenue. A ticker list that ignores the role is a list of companies exposed to the same end market through four different income statements.
Four roles, twelve companies
| Role | What the company sells | Where the enterprise SSD exposure shows up | Companies in this post |
|---|---|---|---|
| ① NAND maker and drive vendor | NAND wafers and finished enterprise SSDs | Bit shipments, ASP, end-market or application-category revenue, management disclosures on calls | Samsung Electronics, SK hynix (incl. Solidigm), Micron (MU), Kioxia (TSE 285A), Sandisk (SNDK) |
| ② Controller and storage-solution vendor | SSD controller chips; some also sell finished drives and modules | Controller revenue, module revenue, product-line growth rates | Silicon Motion (SIMO), Phison (TPEx 8299), Marvell (MRVL) |
| ③ Storage-system vendor | Flash storage systems, software and services | Product revenue, all-flash revenue, hyperscaler design wins | Everpure (P, formerly Pure Storage), NetApp (NTAP) |
| ④ HDD-focused comparison name | Hard drives and HDD-based systems for the same data-center capacity demand | Cloud HDD revenue and guidance; a comparison group, not a short leg | Western Digital (WDC), Seagate (STX) |
Role ① carries the largest absolute dollars, but for Samsung and SK hynix the enterprise SSD business sits inside company results that also include DRAM, HBM and other operations. Role ② ranges from a chip designer whose revenue follows drive units to a vendor that sells finished drives and modules, so the two cannot be read with one rule. Role ③ combines flash hardware with software and services, so component costs matter but are not the whole margin story. Role ④ is in the list because enterprise SSD lists usually include it, and because the HDD makers’ own results show the capacity tier that SSDs are and are not taking. The roles classify each company’s main position; they are not mutually exclusive business-unit definitions.
Role ①: NAND makers — who reports a data-center SSD number
The five NAND makers are the same five that TrendForce ranks by enterprise SSD revenue in the second quarter of 2026: Samsung $14.35 billion (35.1% share), SK hynix group $8.63 billion (21.1%, including Solidigm), Micron $6.98 billion (17.1%), Kioxia $4.64 billion (11.3%), Sandisk $2.98 billion (7.3%). Those are research-firm estimates. What the enterprise SSD stocks themselves report is narrower, and this is where the post diverges from the company-ranking exercise in our memory stocks hub, which covers the makers’ overall disclosure habits. Here the question is only whether a data-center SSD number exists, and what kind of number it is.
Sandisk (SNDK) is the one company of the five that reports an end-market line in its results that maps cleanly onto enterprise SSD. For fiscal Q4 2026 (quarter ended July 3, reported August 5) Datacenter revenue was $2,977 million, up from $1,467 million in the prior quarter and $213 million a year earlier. Edge was $5,432 million and Consumer $556 million, for total revenue of $8,965 million at an 84.6% gross margin. The company attributed roughly one third of its sequential growth to volume and two thirds to pricing. Full-year FY2026 Datacenter revenue was $5,153 million. Guidance for fiscal Q1 2027 is revenue of $10.3 to $10.8 billion. Sandisk’s $2,977 million Datacenter figure for the quarter to July 3 happens to match TrendForce’s calendar-Q2 estimate of $2.98 billion; the periods differ by a few days, so treat the match as a coincidence of scope rather than an independent verification.
Micron (MU) has no SSD line in its earnings release, but it did disclose the number on the call. In the prepared remarks for fiscal Q4 2026 (quarter ended September 3, reported September 30), management said data-center SSD revenue was nearly $10 billion for the quarter, more than ten times the year-ago level and more than two thirds of total NAND revenue. This is an approximate management disclosure, not a separate reportable segment. The release itself shows revenue of $54.229 billion, GAAP gross margin of 86.8%, and business-unit revenue of $18.002 billion for Core Data Center and $16.283 billion for Cloud Memory. Under Micron’s business-unit definitions, Cloud Memory covers memory for large hyperscale customers plus HBM for all data-center customers, and Core Data Center covers memory for OEM customers plus storage for all data-center customers, so neither unit can be read as SSD revenue on its own. Product commentary covered customer shipments of the 7600 PCIe Gen5 and 9650 PCIe Gen6 drives and a production ramp of the 6600 ION high-capacity drive. Micron’s fiscal quarter ends in early September, so its numbers do not line up with TrendForce’s calendar second quarter.
Kioxia (TSE 285A) reported ¥1,174.7 billion of SSD & Storage revenue for April to June 2026 in results released July 31, up 440.3% year on year. The prior quarter’s SSD & Storage revenue was ¥600.3 billion. This is an application category, not a reportable segment: Kioxia reports a single Memory segment, and the SSD & Storage category covers SSDs and memory products for PCs, data centers and enterprises, so it is broader than enterprise SSD revenue. Total revenue was ¥1,767.1 billion, operating profit ¥1,270.0 billion and profit attributable to owners ¥842.2 billion. The company credited the quarter to higher average selling prices on strong demand from data-center customers, and guided second-quarter revenue to ¥2,390.0 billion.
Samsung Electronics reports NAND inside its Device Solutions division and gave server-SSD direction, not dollars, in its second-quarter 2026 results: memory sales were described as led by high-value server products, including server SSDs. A Korean press account of the earnings call quoted an expectation that server SSDs would exceed 60% of Samsung’s 2026 NAND revenue; that is a 2026 outlook from a press report of the call, not a figure in the company’s published results.¹
SK hynix reports as one segment and, like Samsung, described expanded sales of high-value enterprise SSDs in its second-quarter 2026 results without putting a figure on them. TrendForce’s group number includes Solidigm, the company formed from Intel’s NAND and SSD business.
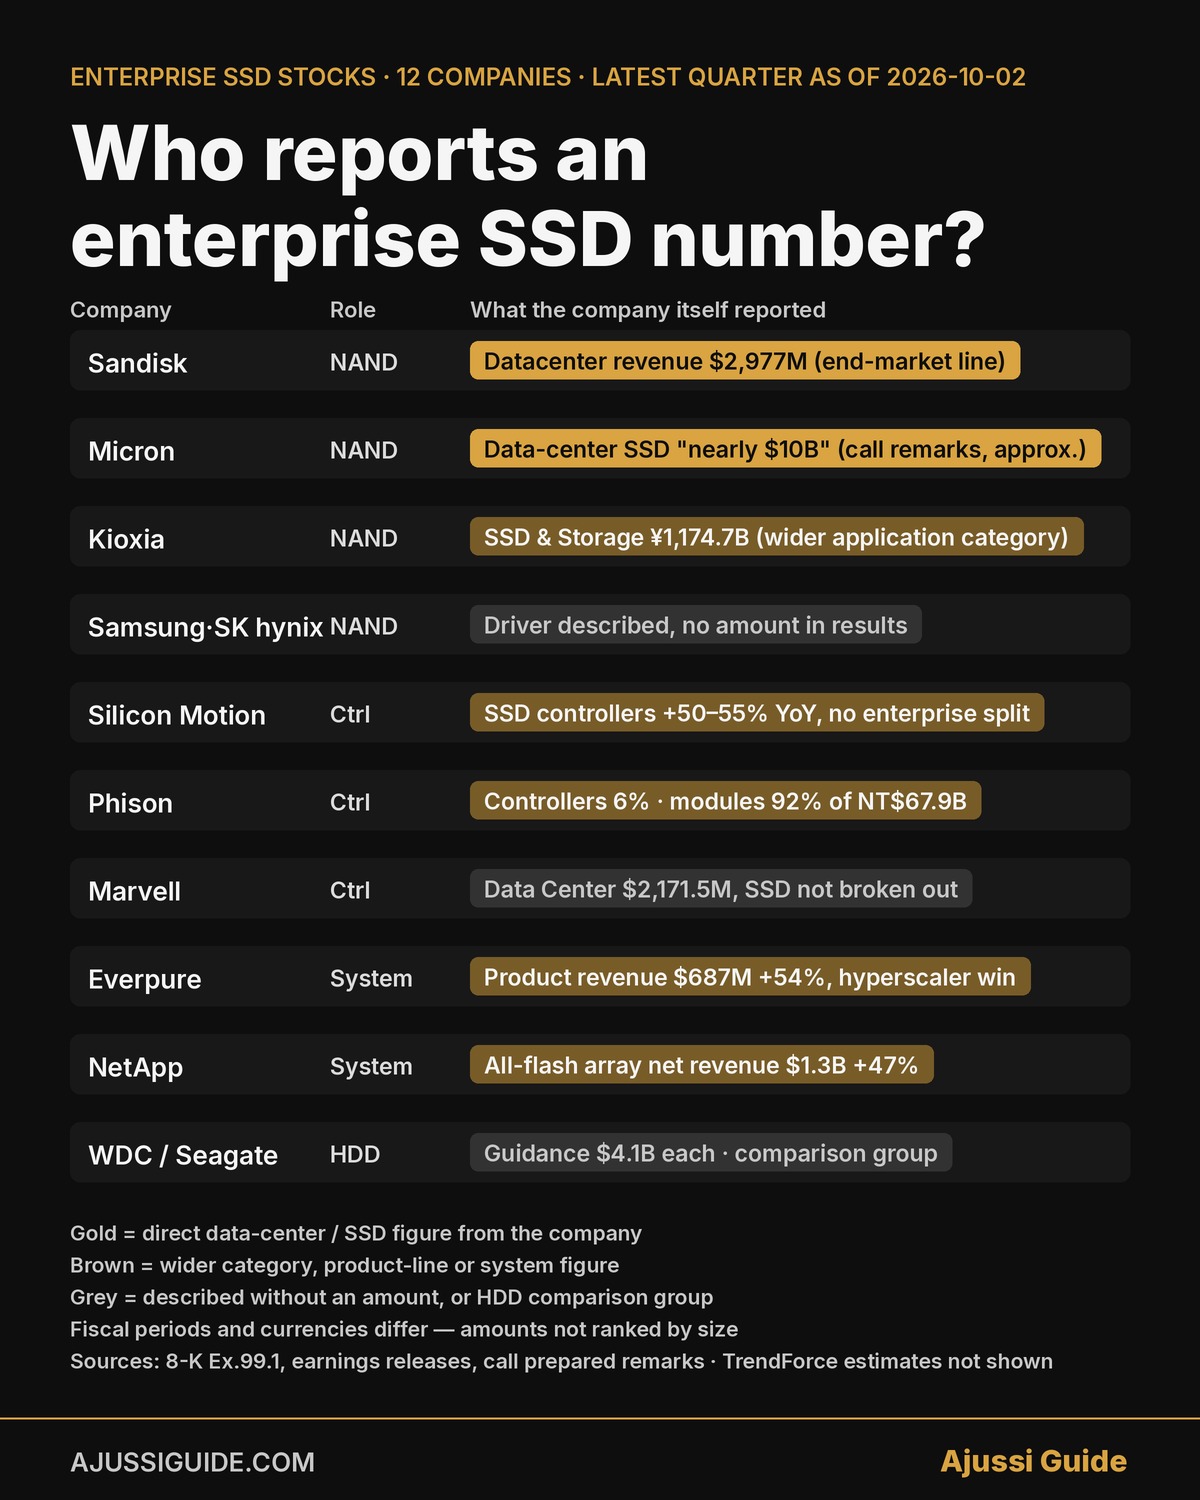
The pattern across the five NAND-maker enterprise SSD stocks: one reports a Datacenter end-market line (Sandisk), one gave an approximate data-center SSD figure on its call (Micron), one reports a wider application category that includes enterprise SSD (Kioxia), and two describe enterprise SSD as a driver without a figure (Samsung, SK hynix). For those two, the enterprise SSD story is read from bit-shipment and ASP commentary, which our memory stocks hub covers.
Role ②: controller and storage-solution vendors
Among enterprise SSD stocks, controller suppliers and storage-solution vendors have different exposure to NAND prices. A pure controller designer earns revenue per drive, so it benefits from unit growth and from the shift to PCIe Gen5 and Gen6 controllers, and it feels NAND pricing only through its customers’ demand. A vendor that also sells finished drives and modules carries NAND in its own cost of goods, so its revenue cannot be treated as controller units multiplied by chip prices. The three companies here sit at different points on that line.
Silicon Motion (SIMO) reported second-quarter 2026 revenue of $451.0 million, up 32% from the prior quarter and 127% from a year earlier, at a 50.2% gross margin (reported July 29). The company gives product-line growth rates rather than dollar splits: SSD controllers up 5 to 10% quarter on quarter and 50 to 55% year on year; eMMC and UFS controllers up 15 to 20% and 95 to 100%; and the Ferri and boot-drive solutions line up 110 to 115% sequentially. Its enterprise platform, MonTitan, covers PCIe Gen5 controllers with Gen6 in development, and the release gives no separate enterprise SSD revenue. Third-quarter guidance is $519 to $541 million. SIMO is the clearest listed controller name, but it also sells Ferri and boot-drive solutions, so even here the revenue is not chips alone, and its enterprise mix is described rather than disclosed.
Phison (TPEx 8299) is a controller designer that earns most of its revenue from finished drives and modules, and its disclosure shows it. Second-quarter 2026 revenue was NT$67.888 billion, up 66% quarter on quarter and 280% year on year, at a 65.3% gross margin, with operating income of NT$26.370 billion and net income of NT$26.219 billion (results announced August 13). June alone was NT$24.853 billion, and first-half revenue of NT$108.855 billion crossed NT$100 billion for the first time. The second-quarter revenue mix from the company’s earnings presentation was controllers 6%, AI ecosystem modules 38%, embedded ODM modules 33%, industrial modules 16%, retail modules 5% and other 2%. The AI ecosystem category includes enterprise SSDs under the Pascari brand but also aiDAPTIV, AI PC, networking, server and boot-drive products, so the 38% is not an enterprise SSD share. Phison reports monthly revenue in Taiwan, which makes it the most frequently updated name in the table.
Marvell (MRVL) sells data-center SSD controllers under the Bravera name, but its second-quarter fiscal 2027 release (quarter ended August 1, reported August 27) does not break them out: total revenue was $2,739.3 million, of which Data Center was $2,171.5 million, or 79%, and the commentary is about connectivity and custom silicon. Marvell is in the table because controller lists include it, not because its SSD revenue can be measured.
Role ③: storage-system vendors
System vendors combine flash hardware with software and services. Component costs matter, but pricing, inventory timing and revenue mix also shape their margins, so a rise or fall in NAND prices does not translate into their results with a fixed sign. Both companies reported after the SSD price moves of mid-2026.
Everpure (NYSE: P) is the company formerly known as Pure Storage. The name change was announced on February 23, 2026, and the ticker changed from PSTG to P with trading from April 17. Second-quarter fiscal 2027 revenue (quarter ended August 2, reported August 26) was $1.2 billion, up 38% year on year, with product revenue of $687 million, up 54%, and subscription services revenue of $499 million, up 20%. Subscription annual recurring revenue was $2.1 billion. On August 10 the company announced a design win with a second top-five hyperscaler built on its DirectFlash architecture, which addresses raw NAND directly rather than through off-the-shelf SSDs. Full-year revenue guidance was raised to $5.03 to $5.07 billion from $4.41 to $4.51 billion. Everpure’s enterprise-flash exposure therefore runs through three channels: its established product business, its subscription base, and hyperscaler design wins that bypass the SSD form factor altogether.
NetApp (NTAP) reported first-quarter fiscal 2027 net revenues of $2.03 billion, up 30% year on year (quarter ended July 31, reported September 2), with product revenue of $987 million against $654 million a year earlier and all-flash array net revenue of $1.3 billion for the quarter, up 47%. The all-flash figure includes support and services attached to flash systems, which is why it exceeds product revenue. The 10-Q also notes that a sales-price increase implemented in the prior quarter supported growth, which is one reason component cost direction alone does not predict the line. Full-year guidance is $7.975 to $8.225 billion.
Role ④: HDD-focused comparison names
Lists of enterprise SSD stocks almost always include Western Digital and Seagate, and the inclusion is useful as a comparison rather than as a trade. The two companies sell the capacity tier that high-capacity QLC SSDs compete with in some workloads and complement in others; Seagate’s own FY2026 annual report describes data-center HDDs and SSDs as complementary in many workloads and competing in some high-performance ones.
Western Digital (WDC), HDD-focused after the Sandisk separation, reported fiscal Q4 2026 revenue of $3.747 billion, up 44% year on year, at a 54.1% GAAP gross margin (quarter ended July 3, reported August 5); full-year revenue was $12.919 billion. Guidance for fiscal Q1 2027 is $4.1 billion plus or minus $100 million. The press release does not include the Cloud end-market split or exabytes shipped; those figures are in the earnings presentation and call, which this post did not use.
Seagate (STX) reported fiscal Q4 2026 revenue of $3.6 billion and net income of $1.294 billion at a 52.3% GAAP gross margin (quarter ended July 3, reported July 29), with full-year revenue of $12.2 billion. Guidance for fiscal Q1 2027 is also $4.1 billion plus or minus $100 million. Seagate’s release speaks of strengthening exabyte demand addressed by its Mozaic platform and HAMR roadmap, and like Western Digital it leaves the exabyte figures to the presentation.
Western Digital and Seagate both guided fiscal Q1 2027 revenue to $4.1 billion, plus or minus $100 million. That supports a picture of strong demand across storage tiers in the same quarter that enterprise SSD revenue doubled, but it does not measure how much workload is shifting between HDDs and SSDs, in either direction.
Enterprise SSD stocks: the disclosure table
The table restates the point of the post in one place for all 12 enterprise SSD stocks: which company reports which enterprise SSD number, and what kind of number it is. The “company figure” column is the most recent reported quarter as of October 2, 2026, and the “research figure” column is the TrendForce calendar-2Q26 enterprise SSD estimate where one exists.
| Company (ticker) | Role | Most recent quarter | Company-reported figure relevant to enterprise SSD | Type of disclosure | Research figure (TrendForce 2Q26 eSSD) |
|---|---|---|---|---|---|
| Samsung Electronics (KRX 005930) | ① | 2Q26 | Server SSD described as a sales driver | Described, no amount in reviewed materials | $14.35B, 35.1% |
| SK hynix (KRX 000660) | ① | 2Q26 | Enterprise SSD described as a sales driver | Described, no amount in reviewed materials | $8.63B group, 21.1% |
| Micron (MU) | ① | FQ4 2026 (to Sep 3) | Data-center SSD revenue “nearly $10 billion” (call prepared remarks); Core Data Center $18.002B and Cloud Memory $16.283B in the release | Approximate direct SSD figure from management | $6.98B, 17.1% |
| Kioxia (TSE 285A) | ① | 1Q FY2026 (Apr–Jun) | SSD & Storage application category ¥1,174.7B | Wider application category incl. enterprise SSD | $4.64B, 11.3% |
| Sandisk (SNDK) | ① | FQ4 2026 (to Jul 3) | Datacenter revenue $2,977M | End-market revenue line | $2.98B, 7.3% |
| Silicon Motion (SIMO) | ② | 2Q26 | Revenue $451.0M; SSD controllers +50–55% YoY; Ferri/boot-drive solutions +110–115% QoQ | Product-line growth rates, no enterprise split | — |
| Phison (TPEx 8299) | ② | 2Q26 | Revenue NT$67.888B; mix controllers 6%, AI ecosystem modules 38%, embedded ODM 33%, industrial 16%, retail 5% | Revenue mix by category, no enterprise SSD split | — |
| Marvell (MRVL) | ② | FQ2 2027 (to Aug 1) | Data Center $2,171.5M of $2,739.3M | SSD controllers not broken out | — |
| Everpure (P) | ③ | FQ2 2027 (to Aug 2) | Product revenue $687M, +54%; second top-five hyperscaler design win | Finished-system revenue | — |
| NetApp (NTAP) | ③ | FQ1 2027 (to Jul 31) | All-flash array net revenue $1.3B, +47% | Finished-system revenue incl. services | — |
| Western Digital (WDC) | ④ | FQ4 2026 (to Jul 3) | Revenue $3.747B, +44%; HDD-focused | Comparison group | — |
| Seagate (STX) | ④ | FQ4 2026 (to Jul 3) | Revenue $3.6B; HDD-focused | Comparison group | — |
Fiscal periods and currencies differ by company, so the amounts in the table are not ranked against each other by size. Read down the “type of disclosure” column: one Datacenter end-market line (Sandisk), one approximate direct SSD figure from management (Micron), one wider application category (Kioxia), three sets of product-line or category mix without an enterprise SSD split (Silicon Motion, Phison, Marvell), two finished-system revenue lines (Everpure, NetApp), two companies that describe the driver without an amount in the materials reviewed (Samsung, SK hynix), and two HDD-focused comparison names.
What a list of enterprise SSD stocks gets wrong
First, “enterprise SSD exposure” is not one thing. Sandisk’s Datacenter revenue, Phison’s module revenue and Everpure’s product revenue all rose sharply in the same quarter, but one is a NAND maker’s price-and-volume number, one is a module vendor’s number with NAND in its own costs, and one is a system number shaped by pricing, mix and services. A change in NAND prices reaches the three through different paths and with no fixed sign.
Second, research rankings of enterprise SSD stocks and company reports measure different things. TrendForce’s $37.59 billion top-five total is an estimate of calendar-quarter enterprise SSD revenue. Sandisk’s reporting period nearly coincides with it; Micron’s fiscal quarter ends two months later, Kioxia’s category is wider, and Samsung and SK hynix publish no comparable line. Use the research number for share, and the company number for trend.
Third, HDD makers are a comparison group, not the short leg of an SSD trade. Western Digital and Seagate both guided fiscal Q1 2027 to $4.1 billion on data-center capacity demand. That is strong demand across tiers; it is not a measurement of displacement, and the companies themselves describe HDDs and SSDs as complementary in many workloads.
Fourth, a name on a list is not a disclosure, and the absence of a line in the release is not the absence of a disclosure. Marvell is a legitimate controller vendor and reports nothing about it. Micron has no SSD line in its release but gave an approximate figure in its prepared remarks. Checking the earnings release alone would have put Micron in the wrong column.
Before choosing
Three checks before buying any of these enterprise SSD stocks. One, find the figure the company itself labels as data-center, SSD, all-flash, controller or module revenue, and look beyond the press release to the call prepared remarks, slides and the revenue notes in the quarterly filing before concluding there is none; if there is still none, write down which materials were checked. Two, note whether the figure is a company number, a management approximation or a research-firm estimate, and do not mix the three in one comparison. Three, write down the role, ① to ④, and ask which of volume, price, mix or system demand the stock actually tracks.
The table reflects company materials available on October 2, 2026. The “company-reported figure” column changes every earnings season, so the date at the top is the one to check.
Frequently asked questions
Which enterprise SSD stocks report data-center SSD revenue directly?
Sandisk reports a Datacenter end-market line ($2,977 million in fiscal Q4 2026). Micron disclosed nearly $10 billion of data-center SSD revenue for fiscal Q4 2026 in its earnings-call prepared remarks, as an approximate figure rather than a reported segment. Kioxia reports an SSD & Storage application category (¥1,174.7 billion for April to June 2026) that is wider than enterprise SSD. Samsung and SK hynix did not give a comparable amount in the materials reviewed.
Are Samsung and SK hynix enterprise SSD stocks?
By TrendForce’s estimate they are the two largest enterprise SSD vendors, with 35.1% and 21.1% of second-quarter 2026 revenue. Neither reports the figure, and their company results include DRAM, HBM and other businesses alongside NAND. They belong on the list with that caveat.
What is the difference between a controller stock and a NAND stock?
A NAND maker earns on bits and price. A controller designer earns on the chip that manages the NAND, so its revenue follows drive units and interface generation. Many controller companies also sell finished drives and modules: Phison’s second-quarter 2026 revenue was 6% controllers and over 90% modules, and Silicon Motion reports growth in Ferri and boot-drive solutions alongside controllers. Those module revenues carry NAND in their own costs, so the “controller stock” label needs checking company by company.
Why is Pure Storage listed as Everpure?
The company announced its rebrand from Pure Storage to Everpure on February 23, 2026, and changed its NYSE ticker from PSTG to P effective April 17, 2026. Its fiscal Q2 2027 results were reported under the new name and ticker.
Should HDD stocks be on a list of enterprise SSD stocks?
They appear on most lists, and their results are useful as a comparison for the same data-center capacity demand. In mid-2026 both Western Digital and Seagate guided fiscal Q1 2027 revenue to $4.1 billion, and Seagate describes HDDs and SSDs as complementary in many workloads, so the two are not behaving as the losing side of a substitution trade in current guidance.
How does this post relate to the Korean SSD post?
The Korean post covers 14 KOSDAQ and KOSPI suppliers, mostly components, assembly and test equipment, using Korean half-year filings. This post covers globally listed companies using US, Japanese and Taiwanese company materials. The two lists do not overlap except for Samsung and SK hynix.
Related: Memory Stocks: How DRAM, NAND and HBM Differ · Server Stocks Guide · HBM ETF Comparison · Semiconductor Stocks Map
This article is for information only and is not investment advice or a recommendation on any security. Last checked: 2026-10-02
Last checked 2026-10-02 · Data: TrendForce 2Q26 enterprise SSD ranking (research estimate), Counterpoint eSSD bit-share, Sandisk FQ4 2026 release, Kioxia 1Q FY2026 earnings release·LC9 245.76 TB, Micron FQ4 2026 release·prepared remarks·business-unit definitions, Samsung 2Q26·Dailian call report (¹ press report of the 7/30 call, a 2026 outlook with Samsung NAND revenue as denominator; not in company materials and not used in the table), SK hynix 2Q26, Silicon Motion 2Q26, Phison 2Q26 results·earnings presentation·monthly revenue, Marvell FQ2 2027, Everpure FQ2 2027·rebrand 2026-02-23·ticker change, NetApp FQ1 2027·10-Q, Western Digital FQ4 2026, Seagate FQ4 2026·FY2026 10-K · Method: latest reported quarter per company; disclosure type classified as end-market line / management approximation / application category / product-line mix / system revenue / described only; fiscal periods and currencies differ, so amounts are not ranked by size; research estimates kept in a separate column · Next update: next earnings season (Micron FQ1 2027 in late December; others October–November)