What this checkedTQQQ against a naive 3x of QQQ across five windows, and the toy math of daily resets that grinds a sideways market.
What it did notit did not test a rebalancing rule or a rebuy rule, and single-stock leveraged ETFs are covered only by the same math, not by their own data.
Watch nextdecay is path-dependent, so the question for any leveraged position is which path the index takes, not the average return.
All figures below are my own calculations from Yahoo Finance adjusted closing prices (distributions reinvested), computed on 2026-09-02[calc]. Change the assumptions and the numbers change.
What Leveraged ETF Decay Actually Is
Leveraged ETF decay – also called volatility drag or beta slippage – is the gap that opens between a daily-reset leveraged fund’s compounded return and the simple multiple of the index return you might expect. A 3x fund like TQQQ targets three times the Nasdaq-100’s return for one day. Over any period longer than a day, its result is the product of daily tripled moves, not three times the period’s move – and those are mathematically different things. To be precise about terms: the volatility-drag component of that gap is always negative, but the fund’s realized multi-day return can still land far above or far below a naive multiple of the underlying’s return, because trend compounding works in the opposite direction.
The internet argues endlessly about whether this decay is a fund-killer or a myth – there is even academic work pushing back on the folk version of the claim. Both camps quote real episodes, so I did what I did for the Korean edition of this analysis: pulled the full price history and ran the numbers – the toy math, the real fund against its naive multiple across five windows, and a 27-year synthetic that includes the one crash the real fund never lived through.
The Toy Math First: Sideways Markets Really Do Grind You Down
Assume the index alternates +5% and -5% ten times each – close to a sideways market. The index itself ends at -2.5%. A daily 2x compounds to -9.6%, and a daily 3x to -20.4%[calc]. No fees, no borrowing costs – just the arithmetic of resetting leverage on a shrinking base. Volatility with no trend is the specific condition where the daily reset works against you, and the drag grows roughly with variance – volatility squared – and with time, all else equal.
That is the “decay is real” half of the story. Here is the other half.
Real Data: TQQQ vs a Naive 3x of QQQ, Five Windows
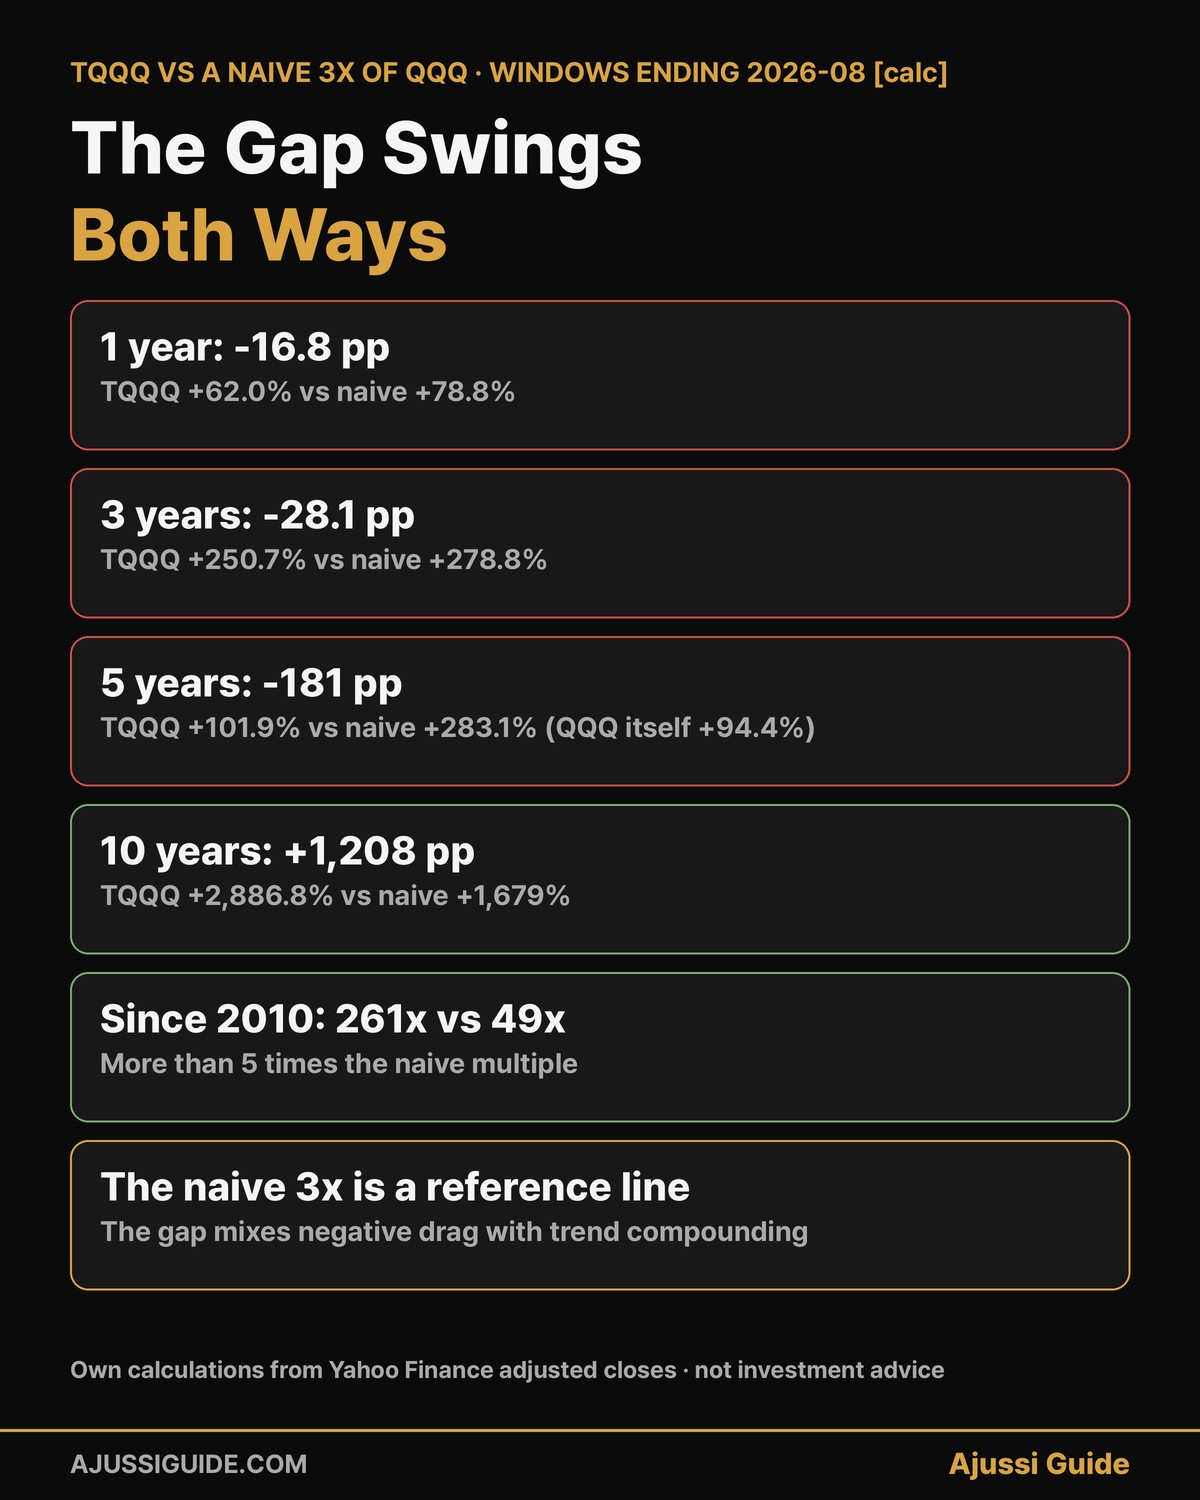
I compared actual TQQQ total returns (distributions reinvested) with a naive benchmark: three times QQQ’s point-to-point cumulative return over the same window, all windows ending August 31, 2026. One thing to be clear about before the table – this naive multiple is a reference line, not a measure of decay itself. The gap against it mixes the negative volatility drag with the positive effect of trend compounding, which is exactly why it can swing both ways:
| Window ending 2026-08 | TQQQ vs naive 3x of QQQ |
|---|---|
| 1 year | TQQQ +62.0% vs naive +78.8% – shortfall of 16.8 percentage points |
| 3 years | TQQQ +250.7% vs naive +278.8% – shortfall of 28.1 pp |
| 5 years | TQQQ +101.9% vs naive +283.1% – shortfall of 181 pp |
| 10 years | TQQQ +2,886.8% vs naive +1,679% – excess of 1,208 pp |
| Since inception (16.4y) | TQQQ 261x vs naive 49x – more than 5 times the naive multiple |
Read that middle row again. The five-year window, which contains the 2022 bear market, is where the drag dominates: TQQQ only slightly outperformed unleveraged QQQ over that window (+101.9% vs +94.4%) while the naive multiple sat at +283%. Then read the bottom rows: over ten years and since inception, trend compounding overwhelmed the drag and carried the fund far above the naive reference line.
This is the resolution of the myth debate. Leveraged ETF decay is real, but it is not a fixed percentage leak that accrues on schedule. The volatility-drag term is always negative; the realized multi-day outcome is path-dependent, ending far below the naive multiple in choppy, range-bound markets and far above it in persistent trends. You don’t get to know in advance which path you’re buying.
The Paths Where Decay Compounds Into Ruin
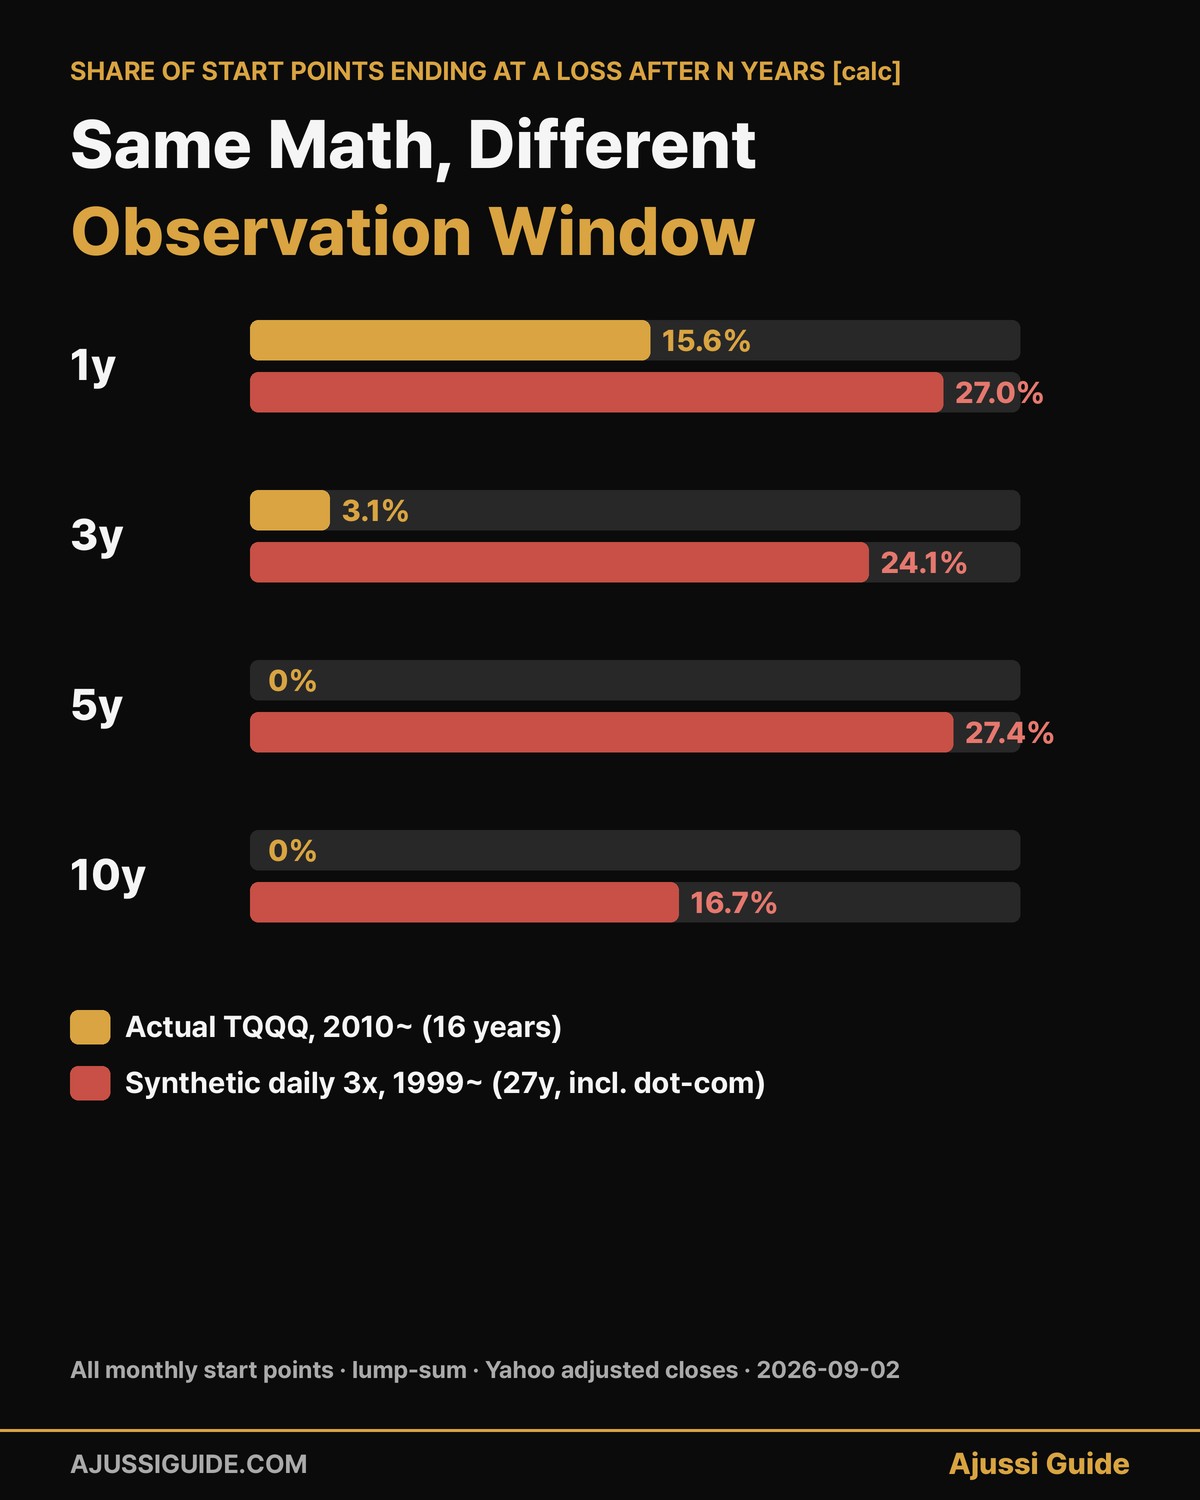
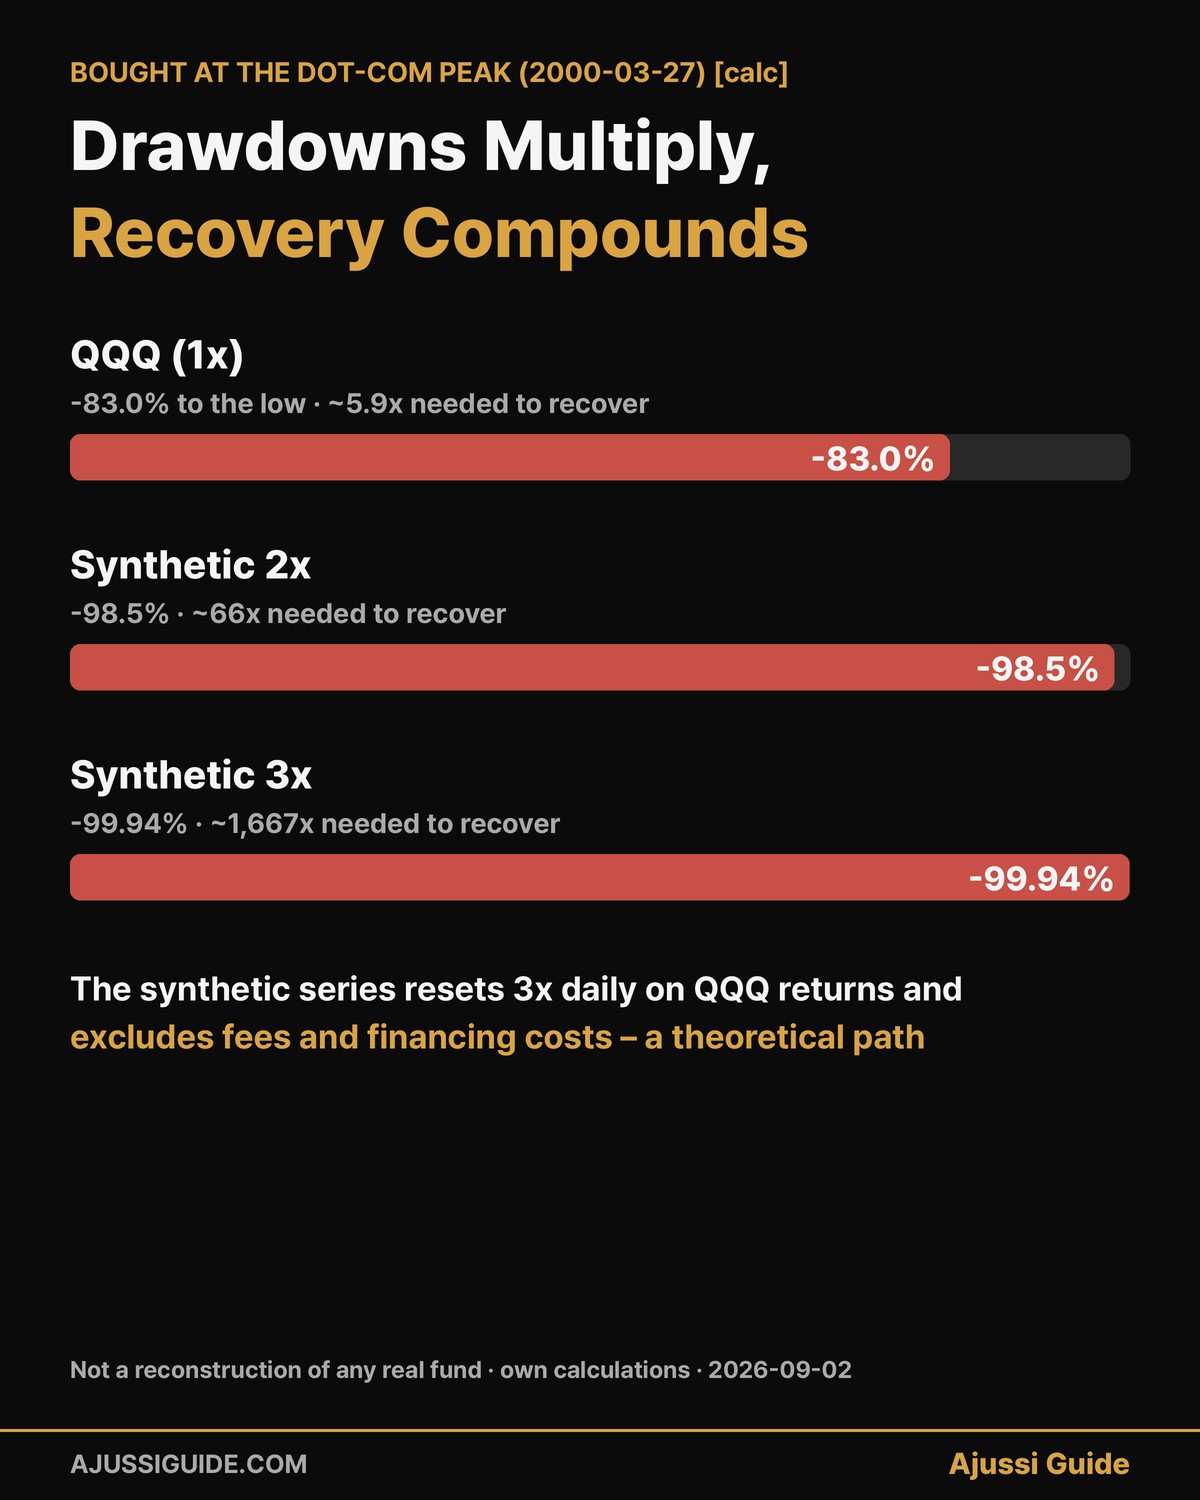
The real TQQQ has only existed since February 2010 – it has never lived through a dot-com-scale crash. To include that era I built a second, different series from the table above: a synthetic daily-reset path that applies 3x (and 2x) to each of QQQ’s daily adjusted returns from March 1999, resetting every day. It excludes fund expenses, financing costs and tracking error, and is not a reconstruction of historical TQQQ NAV – a real fund would have done somewhat worse.
Two results matter. First, across all monthly start points in those 27 years, 16.7% of 10-year holding windows still ended at a loss (the worst at -99.7%) – against 0% for the real fund’s post-2010 history. Overlapping windows aren’t independent trials, but the contrast in observation windows is the point. Second, bought at the dot-com peak in March 2000, QQQ fell 83.0% to its low; the synthetic 2x fell 98.5%; the synthetic 3x fell 99.94%. From there, getting back to even requires the remaining stake to grow about 1,667-fold. Decay in a sideways market bruises you; leveraged compounding through a deep crash is what actually removes you from the game.
Single-Stock Leveraged ETFs Face the Same Math, Amplified
The newer generation of single-stock leveraged ETFs – such as NVDL on Nvidia and 2x Tesla products such as TSLL – runs on exactly the same daily-reset arithmetic. The difference is the input: a single stock is typically far more volatile than a diversified index, and the drag grows roughly with volatility squared, all else equal. Every result above gets harsher when the underlying swings harder, which is why regulators treat single-stock leverage as its own risk category – Korea, for instance, began listing 2x single-stock leveraged products in May 2026 and then tightened investor-protection measures within months as regulators monitored the risks. The formula doesn’t change; the volatility fed into it does. If what you actually want is thematic exposure without daily-reset leverage, that is what plain sector funds are for – the AI semiconductor ETF comparison and data center ETF comparison cover those maps.
Backtest series · 7 posts
- TQQQ long-term hold: 16 real years and 27 synthetic (KO)
- Leveraged ETF decay: what 27 years of numbers show
- QLD monthly investing over 20 years, GFC included (KO)
- SOXL long-term hold: 16 years, where DCA failed too (KO)
- Nasdaq crash history: 14 bear signals in 55 years (KO)
- 2x leveraged ETF long-term hold: Samsung 26 synthetic years (KO)
- Covered call ETF downsides: QYLD, XYLD, JEPI, JEPQ over 12 years (KO)
New backtests and updates are posted to Ajussi Guide Research (Telegram).
Frequently Asked Questions
Is leveraged ETF decay a myth?
No, but it is widely misdescribed. It is not a fixed cost that guarantees losses – over the 16 years since inception, TQQQ returned 261x against a naive 49x. The drag component is real and always negative, but the realized outcome is path-dependent: in volatile sideways markets the fund falls far behind a naive multiple (the 5-year window above trailed by 181 pp), and in steady trends it can far exceed it.
Will a leveraged ETF eventually decay to zero?
Not from decay alone. The +5%/-5% example loses 20.4% per ten round trips, which is severe but not terminal. What takes a daily 3x fund near zero is a deep, fast crash in the underlying – the synthetic 3x lost 99.94% through the dot-com collapse. Decay sets the drag; drawdowns set the catastrophe.
Why do these funds reset daily at all?
The daily reset is what makes the leverage ratio knowable: every trading day starts at exactly 3x. Without it, leverage would drift with the market – rising in drawdowns exactly when you’d want it least. The reset is a design choice with a cost (path dependence) and a benefit (bounded daily exposure), and the issuer documents both: ProShares states TQQQ seeks 3x the Nasdaq-100’s return for a single day and warns that longer holding periods can diverge widely from 3x.
So is holding one long term always a mistake?
The data doesn’t support “always” in either direction. Post-2010, every 10-year hold of the real fund ended positive. Including 1999, one in six synthetic 10-year windows ended at a loss, some near total. The honest summary is that outcomes depend on the observation window, the start date, and the volatility path – which is a different statement than either camp’s slogan. For the full hold-period distributions, see our Korean-language TQQQ backtest, which covers them in depth.
For the unleveraged index itself, the Korean-language companion Nasdaq crash history backtest runs all 14 drawdowns of 20% or more since 1971 through the same rules: sell, hold, or buy the dips, measured five years later.
This article is for information only and is not investment advice or a recommendation on any security. All figures were computed from Yahoo Finance adjusted closes on 2026-09-02[calc]; the synthetic series excludes fees, financing costs and tracking error and does not represent any real fund’s performance. Daily-reset leveraged ETFs can lose close to their entire value.